ESG Economist - Hydrogen revolution seriously challenged

Hydrogen has an important role to play in the energy transition. Renewable hydrogen is identified as one of the most critical technologies to bring down emissions by replacing fossil fuels in sectors that have high mitigation cost for other alternatives, such as hard-to-abate sectors. It can also be used as a clean substitute to natural gas and replace fossil-based hydrogen that is already been used for transport and industrial processes. Additionally, clean hydrogen is one of the solutions to the storage problem (see our report here on energy storage), where it can be used as a mean to store (long-term and large-scale) excess power from renewable resources. The storage potential of hydrogen is particularly beneficial for power grids, as it allows for renewable energy to be kept not only in large quantities but also for long periods of time. This means that renewable hydrogen can help improve the flexibility of power systems by balancing out supply and demand when there is either too much or not enough electricity being generated, helping to boost energy efficiency and the integration of renewables throughout the EU. Furthermore, green hydrogen could play an advantageous role in energy security since domestic renewable capacities can be complemented by a wider range of potential suppliers than fossil fuels. There are several factors governing the development of renewable hydrogen, namely: the technical readiness level of the technologies, the development of renewable capacity, the cost of generating renewable electricity, the cost of the electrolysers, the availability of supportive infrastructure, capacity factors, having a sufficient level of demand, and the accessibility of finance at a reasonable cost (more on these factors below). These factors could differ widely between countries and thus affect their hydrogen development. In this article we dive into the role of green hydrogen (hydrogen produced from renewable sources) in the transition and try to answer the following questions: Why is green hydrogen important for the transition? What is the plan and targets for renewable hydrogen in the EU? Where are we now? What are the challenges? We end with a conclusion.
Hydrogen is set to play a key role in decarbonizing the world with a focus on the traditional sectors, hard-to-abate sectors and its role in energy storage
The European Commission and individual countries have set ambitious targets
There is a large gap between the 2030 targets and what will be reached based on the current and planned projects
Currently only Spain, Portugal and The Netherlands are on track to meet their 2030 targets
The overall EU gap can be associated with several challenges to green hydrogen
The costs to produce green hydrogen are still substantially above those of non-renewable hydrogen
Safety, in terms of flammability and leakage, and other challenges related to the characteristics of hydrogen need to be addressed while developing the infrastructure
Green hydrogen technologies have lower maturity compared to carbon-based technologies
The business case for hydrogen is still associated with several uncertainties making financing more difficult to obtain
European regulation on hydrogen is considered complex and targets are seen as being unrealistic
Why is hydrogen important for the energy transition?
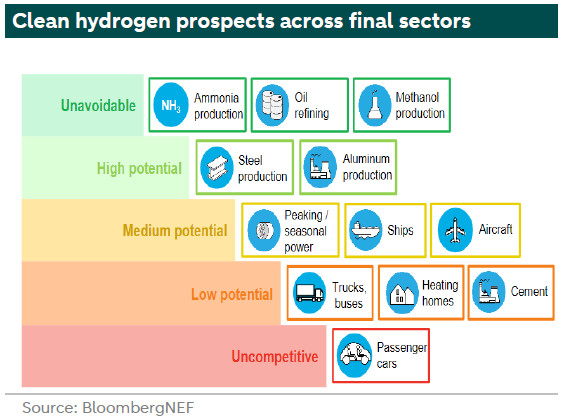
The versality of hydrogen gives it a unique prominent position as one of the key fuels in the future. Hydrogen can be consumed by many sectors. Its prospects across sectors differs widely depending on several factors such as cost, safety and technological readiness. In an earlier ABN AMRO publication (see more here), hydrogen was identified as one of the most critical technologies to bring down emissions. That is, green hydrogen does not only contribute to a more flexible grid (more on this below), it also has an essential role in reducing emissions by replacing fossil fuels in sectors that have limited alternatives, such as hard-to-abate sectors. In that regard, by using green hydrogen in these sectors, dependence on alternative technologies, such as batteries, will be reduced, along with the potential vulnerability to critical metals used in the production of these alternatives. Furthermore, there are no clean energy alternatives to green hydrogen for fertiliser production, hydrogenation, and desulphurisation applications. The chart below summarizes the prospects of hydrogen usage across final use sectors.
In addition to these sectors, even with the existing high conversion losses (more on this in our report on energy storage here), green hydrogen can play an important role in the power sector, by reducing curtailment rates and providing an effective mean for long term power storage. As an energy carrier, the advantage of hydrogen is not only as a medium to store the abundant renewable power, but also to unlock the potential to commercialize green electricity beyond geographical and grid limits, and to be traded between non-neighbouring countries. That is, clean energy can be transported between countries that are abundant in renewable resources and those with limited renewable capacity. As green hydrogen is produced using renewable resources, and as renewable resources are dispersed across many countries, hydrogen could play an advantageous role in energy security since domestic renewable capacities can be complemented by a wider range of potential suppliers than fossil fuels. Moreover, the “cradle to grave” nature of the production process allows mitigating the vulnerability to supply chains and certain suppliers. So for all these reasons, green hydrogen is important for the transition. So what’s the plan to make this a reality?
EU Hydrogen Strategy for 2030
European hydrogen supply strategy
The European Commission (EC) has the ambition to produce 10 million metric tonnes domestically, while importing another 10 million metric tonnes of renewable hydrogen by 2030. The new EU green energy rules exclude fossil hydrogen (hydrogen from fossil fuel with carbon capture and storage - CCS) but it includes hydrogen produced with nuclear energy (pink hydrogen, for more on the definitions of the different types of hydrogen, see the appendix).
Renewable hydrogen is promoted in the EU via several instruments including the targets set out in the (see more ). To ensure that the hydrogen is produced from renewable energy sources and achieves at least 70% greenhouse gas emissions savings, the Commission adopted in June 2023 . The first act (see more ) defines under which conditions hydrogen, hydrogen-based fuels or other energy carriers can be considered as renewable fuels of non-biological origin (RFNBOs). Electrolysers to produce hydrogen will have to be connected to new renewable electricity production. This principle aims to ensure that the generation of renewable hydrogen incentivises an increase in the volume of renewable energy available to the grid compared to what exists already. In this way, it is intended that hydrogen production will support decarbonisation and complement electrification efforts, while avoiding pressure on power generation.
The second act (see more ) provides a methodology for calculating life-cycle greenhouse gas emissions for RFNBOs. The methodology takes into account greenhouse gas emissions across the full lifecycle of the fuels, including upstream emissions, emissions associated with taking electricity from the grid, from processing, and those associated with transporting these fuels to the end-consumer (see more ). The two acts are inter-related and are both necessary for the fuels to be counted towards Member States' renewable energy targets. The new rules will apply to both domestic producers and international producers exporting renewable hydrogen to the EU (see more ).
The focus is to accelerate the uptake of renewable hydrogen, ammonia and other derivatives in hard-to-decarbonise sectors, such as transport, and in energy-intensive industrial processes. The Commission acknowledges that supporting hydrogen uptake in the EU would rely on scaling up the development of hydrogen infrastructure and supporting hydrogen investments (see more ). The Commission estimates that around 500 TWh of renewable electricity is needed to meet the 2030 ambition in REPowerEU of producing 10 million tonnes of renewable fuels of non-biological origin (RFNBOs). The 10 million metric tons by 2030 corresponds to 14% of total EU electricity consumption (see more ). In an integrated energy system, hydrogen can support the decarbonisation of industry, transport, power generation and buildings across Europe. The addresses how to transform this potential into reality, through investments, regulation, market creation and research and innovation. This will be a gradual transition that requires a phased approach (see more ):
2020-2024: the installation of at least 6 gigawatts of renewable hydrogen electrolysers in the EU, and the production of up to one million tonnes of renewable hydrogen
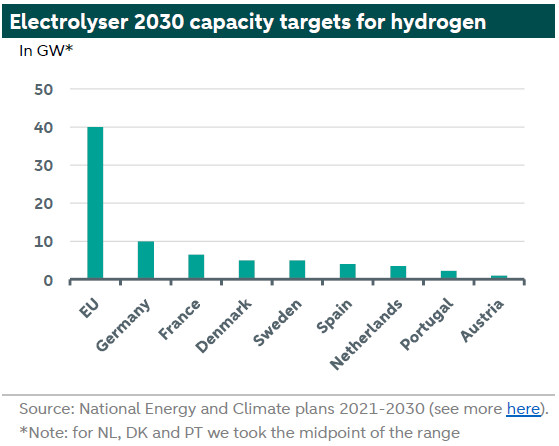
2025-2030: at least 40 gigawatts of renewable hydrogen electrolysers (see graph below) and the production of up to ten million metric tonnes of renewable hydrogen in the EU by 2030.
2030-2050: renewable hydrogen technologies should reach maturity and be deployed at large scale across all hard-to-decarbonise sectors.
20 key actions
The EU hydrogen Strategy has 20 key actions (see more ), which aim to boost demand, scale up production, design and enable a support network, as well as the international dimension. Within these 20 key actions there are several actions to support demand. One of them is to propose measures to facilitate the use of hydrogen and its derivatives in the transport sector in the Commission’s Sustainable and Smart Mobility Strategy. Another one is to explore additional support measures, including demand-side policies in end-use sectors, for renewable hydrogen building on the existing provisions of the Renewable Energy Directive.
Europe has also been trying to incentivize demand by enforcing consumption quotas on industry. That is, making a specific share of renewable hydrogen compulsory for use in industry. The Commission aims for 42% of hydrogen used by industry to come from renewable sources by 2030. The encouragement of clean hydrogen demand through quotas has been effective in the EU and other parts of the world such as South Korea. However, other incentives are still needed to catalyse demand further in order to reach climate goals.
European Commission proposed target for 2040 and scenarios
The European Commission set out a proposal to strengthen climate policy beyond 2030, with emission reduction targets. In that direction, it formulated three different scenarios. Target option 1 is a net GHG reduction target of up to 80% (S1) by 2040. This is compatible with a linear trajectory of net GHG emissions between the existing 2030 target and the 2050 climate neutrality. Target option 2 is net GHG target reductions in 2040 of at least 85% and up to 90% (S2). Target option 3 is a net GHG reduction target in 2040 of at least 90% and up to 95% (S3). It recommended a target that sits somewhere between options 2 and 3. Next to these scenarios there is a more sustainable lifestyles scenario or LIFE . These different scenarios also work out differently for hydrogen. For example in 2040, the S3 scenario projects more than 60% more hydrogen production in comparison to S1, with most of the difference related to demand for e-fuels. The LIFE scenario reduces demand for renewable hydrogen by around 15 Mtoe with circular economy measures and consumption patterns (see more ).
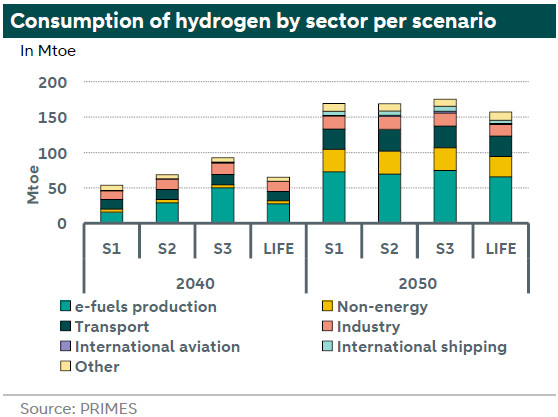
The consumption of hydrogen as an energy vector beyond traditional applications (like the chemical sector and refineries) contributes to decarbonise the hard-to-abate sectors and to support the operation of the power sector with high shares of variables renewable energies providing seasonal storage. In these scenarios, for this decade, the consumption of hydrogen remains limited (see the chart above), both because hydrogen-based technologies are generally characterised by relatively low maturity levels and higher marginal abatement costs. Hydrogen consumption rapidly scales up, achieving in 55-95 Mtoe in the S1-S2-S3 scenarios by 2040. The production of e-fuels (both gaseous and liquid) accounts for the lion’s share of total hydrogen consumption in 2040, followed by industry and – very closely – transport (in the S1, in 2040 the consumption of hydrogen in transport is higher than in industry). These three sectors alone account for more than three quarters of total hydrogen consumption in 2040 in all scenarios. As a large deployment of e-fuels occurs in S3, this scenario experiences the highest level of hydrogen consumption in 2040 (around 95 Mtoe) and is characterised by a tremendous growth in hydrogen use in the next decade. In 2050, the consumption of hydrogen doubles compared to 2040 (see more ).
Where are we now?
Hydrogen demand
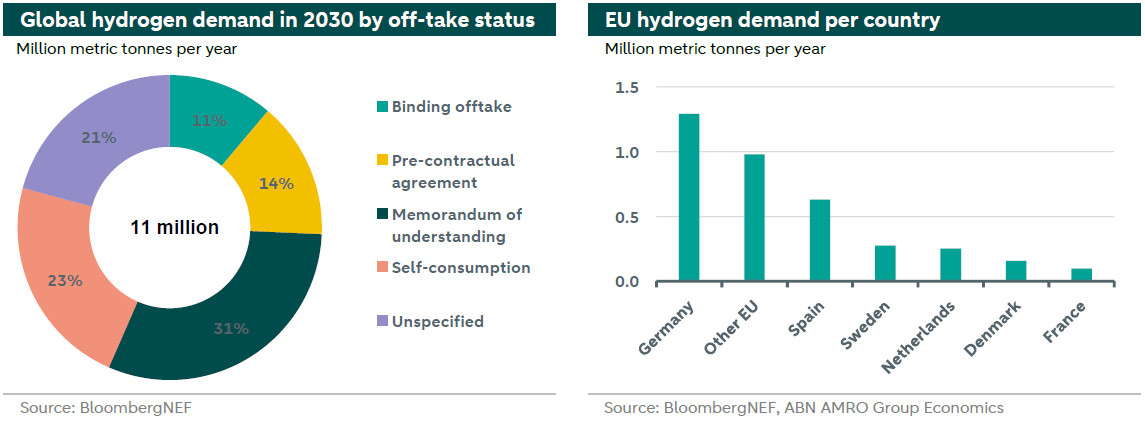
Global hydrogen demand remains low compared to that of supply, with only 12% of global clean hydrogen production capacity planned for commissioning by 2030 (61 million metric tons) having identified an off-taker, as of April 2024 (see left hand chart on below for off-takers status). At the same time, there is just 11% of these contracts with binding status, highlighting the demand uncertainty, which in turn affects the incentives to develop the supply further. We note that, according to BloombergNEF, the growth in hydrogen demand is faster in power, steel and renewable fuels compared to other traditional usage sectors such as oil refining and fertilizers.
In 2022, hydrogen accounted for less than 2% of Europe’s energy consumption and was primarily used to produce chemical products, such as plastics and fertilisers. 96% of this hydrogen was produced from natural gas, resulting in significant amounts of CO2 emissions. With a focus on EU hydrogen demand in 2030, there is around 3.68 million metric tons (mmt) of offtake contracts under different statuses. This amount falls short with the intended domestic supply target of 20 million metric ton (of which 10 mmt imported). Most of this capacity is located in Germany and Spain and intended for domestic use, as can be seen in the chart below (right).
Hydrogen supply
In 2024 the EU is expected to produce 0.04 million metric tons of green hydrogen (BloombergNEF). Based on current list of projects under different development statuses, the total forecasted supply for the EU in 2030 is 3.2 million metric ton per year associated to 25.2 GW of accumulated capacity as illustrated in the charts below, of which only 2.6 GW are operational or reached the Final Investment Decision (FID) stage. This means that current (planned) hydrogen development falls short by 14.8 GW of targeted installed capacity. Furthermore, as the charts clearly show, most of the projects are in the Front-End Engineering Design (FEED)(1) or Pre-FEED stages, which still incorporate high uncertainty whether these project will actually materialize.
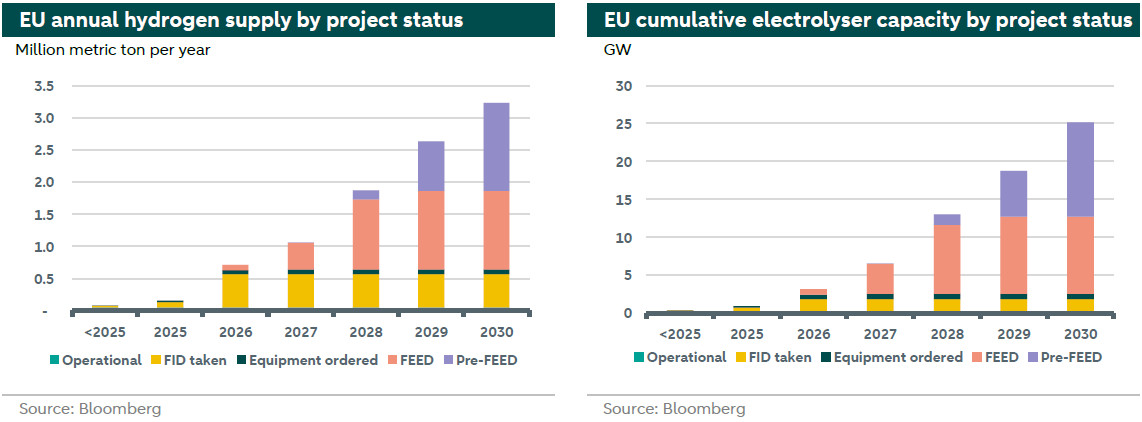
The Netherlands aims to have 0.5 GW by 2025 and 4 GW by 2030 (2) (see more on the Dutch strategy and targets in the appendix). However, the current cumulative capacity indicates 0.2 GW in 2025 and 3.8 GW in 2030 if all announced projects materialize in time. This capacity is enough to supply 0.69 million metric tons on a yearly basis, leaving the country a bit short of meeting its targets. On the other hand, Germany is on the way to build 5.4 GW by 2030, which implies a whopping 4.6 GW gap from the country’s target to reach 10GW of installed hydrogen capacity in 2030.
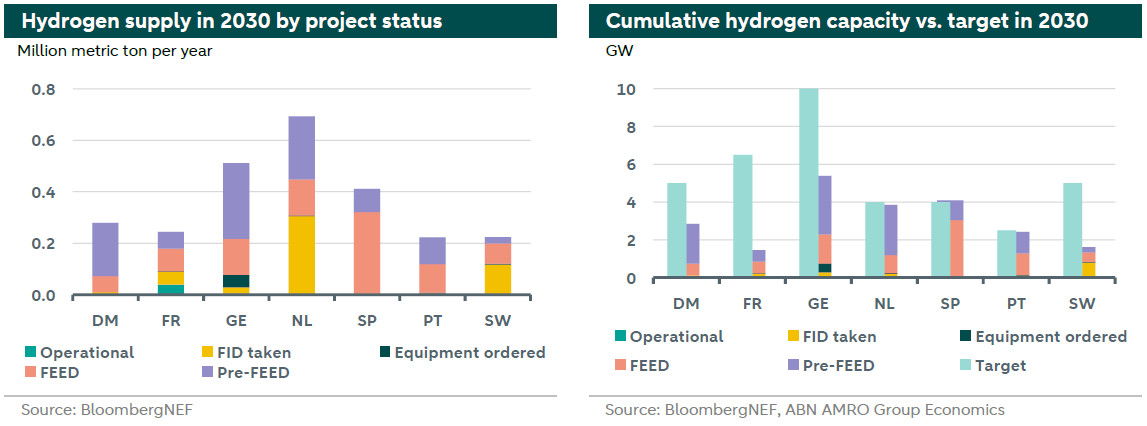
In summary, the right-hand chart above illustrates that most European countries are far away from reaching their electrolysers capacity targets, including France, Germany, and Sweden, while only Spain, Portugal and The Netherlands are close to meet their targets of 2030. Looking at the pipeline of projects announced until 2030, a mere percentage are up and running or have reached a final investment decision.
As the potential renewable capacity for European countries is not enough to produce all its needs of green hydrogen domestically, Europe will have to rely heavily on imports to achieve its targets.
European hydrogen development
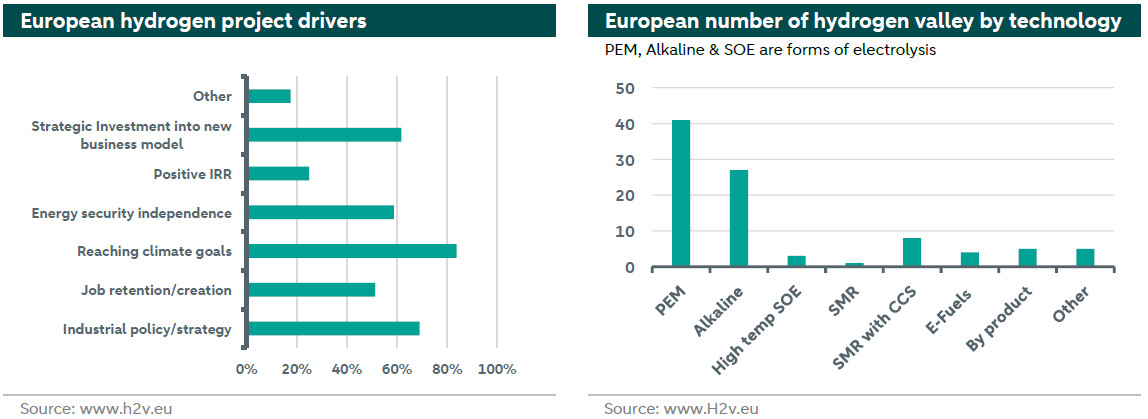
There are leading hydrogen projects across the EU, such as the HH2E electrolyser project — set to become one of Germany’s biggest and the Holland hydrogen 1 with a capacity of 200MW. In order to understand the dynamics of hydrogen development in Europe, we need to understand the main drivers of hydrogen investments. In a survey about the drivers leading hydrogen projects in Europe, the majority of respondents (84%) identified “reaching climate goals” as a leading driver. “Industrial policy” and “strategic investments into new business models” are also two of the main drivers for hydrogen development, as can be seen in the chart below (left). An overview on the current number European hydrogen valleys and the associated technology is shown in the right hand chart below.
What are the challenges?
The hydrogen strategy is facing significant challenges resulting in a substantial deviation between the plans/strategy and what will be achieved. The challenges range from hydrogen-specific characteristics, transportation, the technical readiness level of the technologies to the costs associated to produce hydrogen, regulation and finance. We discuss each of these challenges below.
Hydrogen characteristics
We start with specific characteristics of hydrogen and compare it to its main substitute, natural gas. Taking these characteristics into account, we can determine whether hydrogen can be transported via the existing gas infrastructure. Important characteristics are combustion, greenhouse gases, leakage risk and volume.
Controlling combustion
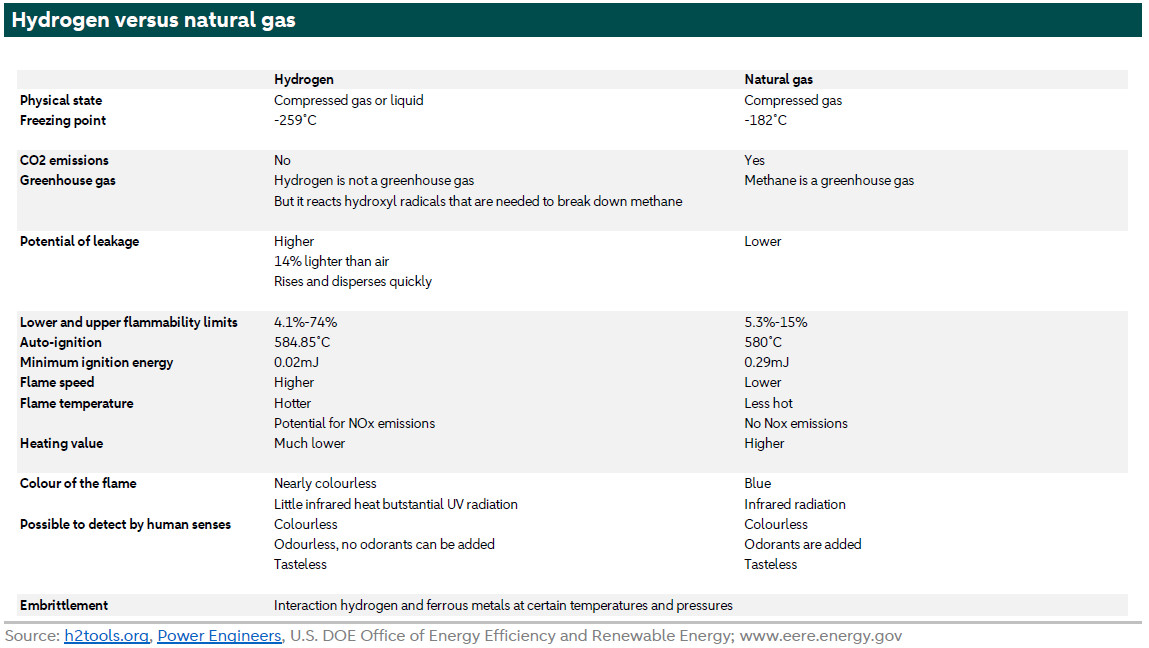
Combustion will only occur if there is fuel, oxygen and an ignition source. Hydrogen will burn with both lower amounts and higher amounts of air present compared to natural gas. The difference is quite large as the table below shows. For hydrogen this is 4%-74% and for natural gas this is 5.3%-15% (see table below). A wide flammability range makes controlling the combustion of hydrogen more difficult than controlling the combustion of natural gas. In addition, the flame of hydrogen travels faster from starting point through the unburned air and fuel mixture compared to natural gas. The flame speed of hydrogen is 1.7 metres per second, while the flame speed of natural gas is 0.4 meters per second. This also makes it more difficult to control the combustion. Furthermore, hydrogen has an invisible flame that radiates little infrared heat but substantial UV heat. The flame of natural gas is blue and produces infrared radiation. The sensation of both flames is different, but they both have a harmful effect on the skin and especially on the eyes. Also, hydrogen flames are hotter meaning that not all material is suited in the infrastructure such as high strength ferritic and martensitic steels (see more ).
Greenhouse gasses
As there is no carbon in hydrogen (H2) it will not create CO2 as is the case with methane/natural gas (CH4). So hydrogen is a zero-carbon fuel. But as hydrogen burns with a hotter flame there is potential for Nitrogen Oxide (NOx) emissions. The primary source of NOx in most gas-fired systems comes from the ambient air itself, as its dominant constituents (nitrogen, N2, and oxygen, O2) react together under high temperature conditions. So, H2 combustion does generate NOx since NOx is formed when air is heated to high temperatures (see more ).
In addition, while hydrogen may not be a greenhouse gas per se, it indirectly is. Hydrogen is a clean fuel when it reacts with oxygen in a controlled application, with water vapour as the end-product. That is why there is so much focus on hydrogen in reducing CO2 emissions. However, when pure hydrogen leaks (more on this below) and starts to react in uncontrolled conditions with other compounds that are present in the atmosphere, the outcome becomes less desirable (see more ). It reacts with hydroxyl radical in the atmosphere, which would normally react with methane. The hydroxyl radicals that react with hydrogen can’t react with methane, which leaves more methane into the atmosphere. The reaction between hydrogen and hydroxyl radical also leads to more ozone in the atmosphere and more water vapour high in the atmosphere (see more ). Altogether, hydrogen may not be as green as generally assumed.
Leakage risk
Another important characteristic is that hydrogen (H2) is smaller and lighter than any other molecule. This increases the potential for leakage. The potential for leakage is higher for hydrogen compared to natural gas. It is 14% lighter than air and it rises and disperses quickly (see more ). This needs to be taken into account when developing the associated infrastructure.
Volume
Hydrogen has 2.5 times the energy density of natural gas. But because hydrogen is so much lighter you need approximately three times the volume of hydrogen as compared to natural gas to get the same amount of energy. So the pressure of the fuel supply is increased or the volumetric flow (see more ). The infrastructure needs to be accustomed to this.
Liquid hydrogen
Liquid hydrogen has different characteristics and additional potential hazards compared to gaseous hydrogen. As such, additional control measures are used to ensure safety. As a liquid, hydrogen is stored under pressure at around -245°C (-410°F), a temperature that can cause cryogenic burns or lung damage. The volume ratio of liquid to gas is approximately 1:848. Liquid hydrogen is also colourless. It is extremely cold and only persists if maintained in a cryogenic storage vessel. Storage is usually under pressures up to 1000 kPa (150 psi). If spilled on ambient-temperature surfaces, liquid hydrogen will rapidly boil and its vapours will expand rapidly, increasing 848 times in volume as it warms to room temperatures (see more ).
To sum up, a combustion in hydrogen is more difficult to control and there are serious safety risks, the risk of leakage is higher than with natural gas, the infrastructure needs to manage the difference in volume and hydrogen can also produce indirect greenhouse gasses.
Transportation
One of the crucial components for clean hydrogen development is the readiness of transport infrastructure and storage. European countries are among many countries that have already published a specific strategy for hydrogen development. Most countries are moving forward with a hydrogen strategy, with the exception of Mexico and central African countries. Midstream policies in Europe have been mainly focused on transportation infrastructure, while those concerning storage are still lagging behind both in terms of coverage and the stage of legislation. Germany stands out as one of the EU countries with clear priority for developing one of the biggest hydrogen networks in order to reach its net zero targets.
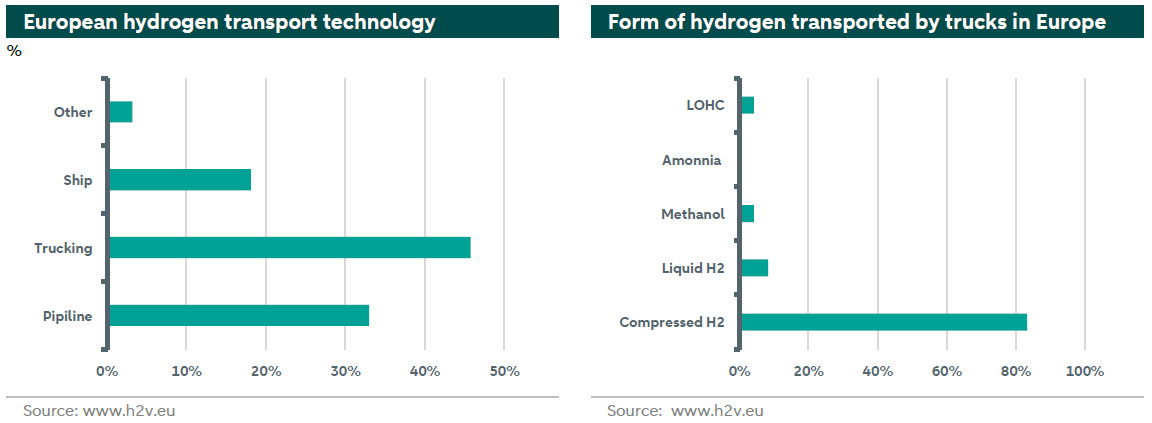
Hydrogen can be transported in a gaseous state in high-pressure containers or in a liquid state at a cryogenic temperature in thermally insulated containers. Almost 97% of the green hydrogen transported through pipelines comes in a compressed hydrogen form.
This form also dominates the share of hydrogen transported by trucks at 83%. The rest of hydrogen transported by trucks is in a liquid H2 form (8%), Methanol (4%), or liquid organic hydrogen carrier (LOHC) (4%), as illustrated in the chart above on the right. Currently, there is a good infrastructure for natural gas but limited infrastructure for hydrogen. In a net-zero scenario, demand for natural gas will decline over time while that of hydrogen will increase. Above we already saw the differences between natural gas and hydrogen. What does this mean for the usage of gas infrastructure for hydrogen?
Using existing natural gas (NG) pipelines
At standard conditions, methane/natural gas has three times the calorific heating value per cubic meter of hydrogen. Assuming the same operating pressure and the same pressure drop along the pipeline, hydrogen will also flow at three times the velocity due to its low density. The same gas pipeline that today transports mainly natural gas, can transport about three times as many cubic meters of hydrogen during a given period while delivering roughly the same amount of energy. This results in the energy transportation capacity for hydrogen being only slightly smaller compared to high-calorific natural gas (see more ). To enable an energy flow of hydrogen equivalent to 80-90% of the flow of natural gas, approximately three times the compression power would be required for hydrogen compared to the power required for natural gas (see more ). In addition, existing gas pipelines need to be adjusted taking into account the characteristics of hydrogen (see above) in order to transport 100% hydrogen or a blend.
The pipelines that transport hydrogen are made of the same basic material as most of those built for natural gas: namely steel. Hydrogen is a much smaller molecule than methane, the main component in natural gas. In fact, hydrogen is the smallest molecule on Earth. Its size means it can squeeze into tiny spaces in certain steel alloys in a way that natural gas cannot. That can cause “embrittlement,” making the metal more likely to crack or corrode. Hydrogen can accelerate pipeline steel degradation, which occurs primarily in the form of embrittlement, causing cracks and eventually result in pipeline failure. To overcome this, potential solutions include using fibre reinforced polymer (FRP) pipelines for hydrogen distribution (see more ). There are also technical remedies to prevent embrittlement (see more ).
Because of its small size hydrogen molecules are also much more likely to leak from valves, seals, and other connection points on pipelines. And hydrogen is transported in a more pressurized state than natural gas, which puts more stress on the pipeline carrying it (see more ). A complete switch to 100% hydrogen pipeline requires installing new turbines or motors and new compressors.
The repurposing of existing natural gas infrastructure to hydrogen implies dealing with several technical challenges linked to the different chemical properties of hydrogen in comparison to natural gas. In general terms, the technical state and chemical composition of infrastructure materials need to be considered when assessing if existing pipelines can transport 100% hydrogen. According to the European Backbone Report, the average repurposing costs of transmission pipelines are expected to be between 10 and 35% of the construction costs for new dedicated hydrogen pipelines (see more ). Another estimation of the cost of repurposed pipelines could be 0.2–0.6 M€/km whereas the building of new pipelines could cost 1.4–3.4 M€/km (see more ). Rather than transporting 100% hydrogen, blending may work better with existing pipelines.
Blending natural gas with hydrogen and transport it via natural gas pipelines
Hydrogen could be blended with natural gas for transport in existing pipelines. The maximum allowable hydrogen concentration depends mainly on pressure fluctuations, structure and existing defects. However, most research to date indicates that, for some grid sections, certain blending percentages (e.g. 2% – 10% hydrogen share in volumetric terms) are technically feasible with few adaptations in some Member States. Higher percentages could lead embrittlement or greater chance of pipeline leaks. Although additional tests are needed, some operators consider 20% the upper bound due in particular to the requirements for downstream users to be adapted beyond this point (see more ). Hydrogen has a significantly lower molar weight than natural gas, which is a parameter for the commonly used centrifugal compressors. Therefore, existing compressors are usually not fully optimised for blends, although different compressors models react in different ways to hydrogen blends. A hydrogen share below 10% only leads to minor changes of existing compressors, while a share of above 40% requires its replacement (see more ).
European Hydrogen Backbone
The European Hydrogen Backbone (EHB) is a vision of 11 gas Transmission System Operators (TSOs) from 10 European countries on the future role of the gas infrastructure. The EHB initiative has grown to 23 European gas TSOs with gas networks covering 19 EU Member States plus the United Kingdom and Switzerland. By 2040, the proposed backbone can have a total length of 39,700 km, consisting of approximately 69% retrofitted existing infrastructure and 31% of new hydrogen pipelines (see more ). We note that Capex for a new pure hydrogen pipeline are 110-150% of those for a new natural gas pipeline with similar diameter (see more ). The 39,700 km European Hydrogen Backbone for 2040 requires an estimated total investment of EUR 43-81 billion (see more ).
Technologies to produce hydrogen
We have looked at the challenges of hydrogen characteristics and infrastructure. Now we focus on the different technologies and their technical readiness levels (TRL). The higher the TRL, the more mature the technology. Level 1 indicates basic principles observed. Level 4 indicates that the technology is validated in lab. Level 11 indicates proof of stability reached. The table below summarises the results. The technologies are ordered by most mature technology to the least mature technology.
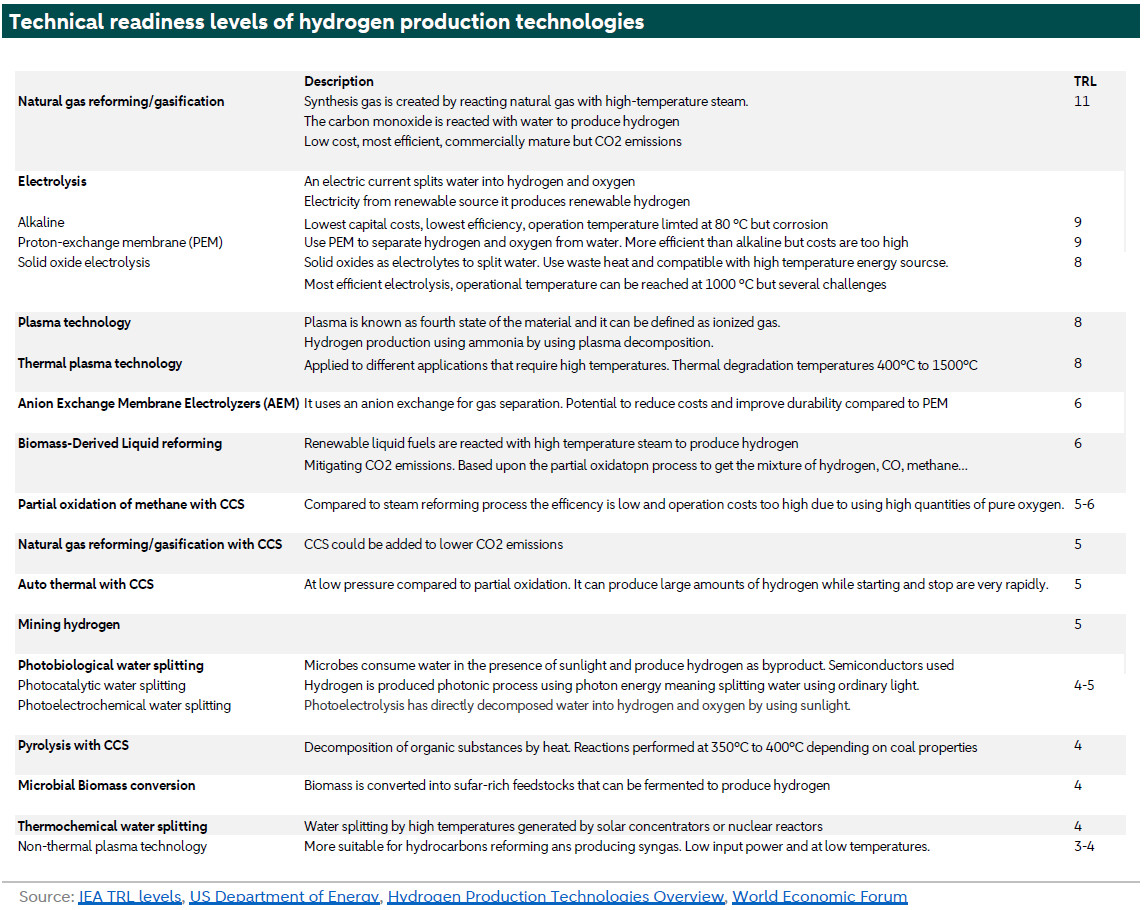
The most polluting hydrogen production technologies, such as natural gas reforming are already in use and are currently producing most of the hydrogen available today. To decarbonize the world, the technologies that produce hydrogen with the lowest possible emissions are favoured such as the different forms of electrolysis. These technologies currently have lower technical readiness levels.
Costs
There are three main leading factors that affect the costs of producing renewable hydrogen the most, namely: the cost of renewable power, the electrolyser costs, and the capacity factors that measures the percentage time the electrolyser is operating.
European renewable power
The cost of renewable power differs widely across countries. Countries that are abundant with renewable resources are better positioned to develop renewable hydrogen. Those are mainly countries located in areas with long stable sunny days or stronger wind. For example, European countries with access to the North sea, like the Netherlands, can develop offshore wind power at relatively lower costs, while Southern European counterparts, with longer sunny days and clear skies, like Spain, are more competitive in developing solar power. Levelized Cost of Electricity (LCOE) is a widely used measure to compare the (all-in) cost of development of renewable energy projects. The chart below depicts the LCOE across some European countries and main renewable technologies.
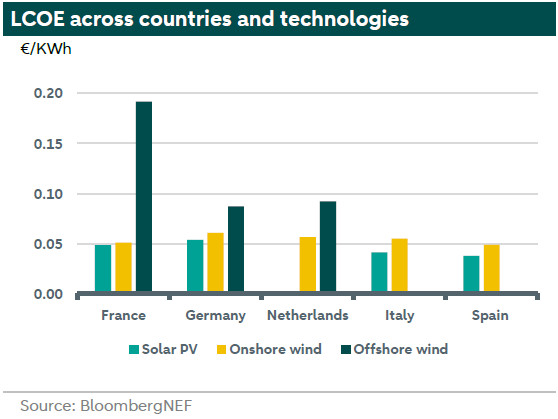
The chart above shows that solar PV is the cheapest source of renewable electricity across selected countries, followed by onshore and offshore wind, respectively. Furthermore, the LCOE for offshore wind development is (by far) the most expensive in France followed by The Netherlands, and Germany. The differences in LCOE among these countries can be explained by the inherit differences in the technology capacity factor, along with the differences in the Capex costs.
The cost of electrolysers
Globally, China is dominating the production of electrolysers. However, other markets are catching up, with around 42%-45% of global shipments from Europe, EMEA, and AMER together in 2023. With regard to the shares of electrolysers technologies, Proton Exchange Membrane (PEM) is gaining momentum in EMEA and AMER driving the share of alkaline downwards towards 70% (see more ).
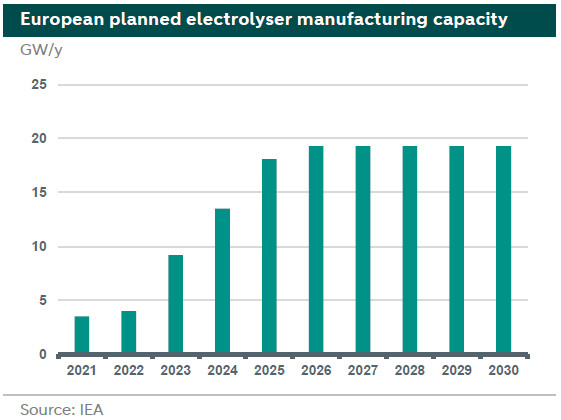
Europe could play an important role in electrolyser manufacturing with an expected 34% cumulative average growth rate for installed capacity in the upcoming six years, if all announced projects were to be realised, according to a recent report by the IEA (see more ) (see graph above). In that direction, in July 2022, the EC approved EUR 5.4 billion for the funding of Hy2Tech project with the aim to encourage hydrogen technologies and incentivize manufacturing of electrolysers ().
Levelized cost of hydrogen in Europe
Levelized Cost of Hydrogen (LCOH) is one of the main measures used to compare hydrogen projects across different technologies and between countries. It reflects the average revenue needed to recover the development, construction and operation of a hydrogen plant during an assumed financial life and duty cycle. Accordingly, LCOH is calculated by dividing the discounted costs over the lifetime of the hydrogen generating plant by the discounted sum of actual hydrogen amounts delivered. For our purpose, LCOH is measured in €/Kg. The chart below depicts the LCOH for selected technologies and European countries.
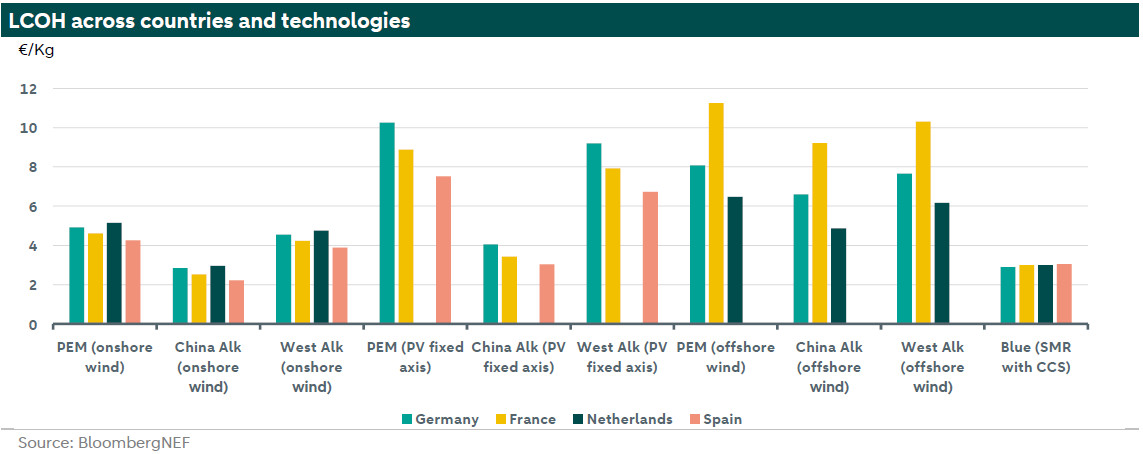
The chart above shows the LCOH distinguishing between PEM and Alkaline electrolysers. Alkaline is further differentiated based on where the electrolyser is produced into Chinese and Western Alkaline electrolysers. Finally, as the cost of renewable electricity is the main operating cost for hydrogen projects, the LCOH takes into account the source of renewable power. The LCOH is lowest for hydrogen projects using Chinese Alkaline electrolysers regardless of the source of renewable power, while projects using onshore wind power are the most competitive even when compared to blue hydrogen (using SMR with 95% CCS). This is true for all selected countries with the lowest cost in Spain. Electrolysis powered through offshore wind are most competitive in the Netherlands.
Please note that these results are based on data from the first half of 2023. With recent lower gas prices, blue hydrogen remains the most competitive hydrogen with lower emissions today. Most of renewable hydrogen costs are expected to decrease as we move towards 2050. By 2030, green hydrogen is set to cost around 1.81 €/kg in the EU down from around 4.5 €/kg in 2023, according to BloombergNEF. Furthermore, carbon pricing plays an essential role in incentivizing the adoption of green hydrogen in different sectors, such as the production of green steel. Currently, in most countries, green hydrogen is more expensive than grey and blue ones. In the long term however, with more installed renewable power capacity and more developed infrastructure, higher CO2 emission costs, and a lower cost for electrolysers, green hydrogen production costs are expected to decrease substantially. By 2050, green hydrogen is set to outcompete the costs of grey and blue hydrogen, meaning that green hydrogen will be cheaper than grey and blue hydrogen. Moreover, according to BloombergNEF, in some regions and countries with high prices for natural gas, such as Japan or South Korea, or low cost of renewable power generation, such as Brazil, Chile and UAE, green hydrogen could even outcompete natural gas.
Regulation
In identifying the reasons behind the shortfall of hydrogen targets, we start from the mechanism by which these targets were set in the first place. One argument is that these targets are too ambitious and were not based on solid analysis, rather, they reflected political hope and aspiration. Furthermore, one argues that there was limited coordination between industry and the Commission when the targets were set, and the targets failed to align with member states’ ambitions. Additionally, the process of reaching an agreement on the definition rules for clean hydrogen were lengthy, which led to many projects waiting for clarity to be postponed.
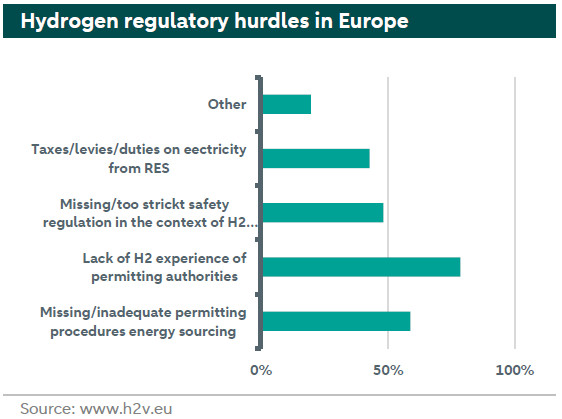
Furthermore, European hydrogen legislation is considered more complex compared to other jurisdictions, such as the US. For example, under the EU plans, the definition of green hydrogen is linked to the use of excessive designated renewable power, which undermines the business case for green hydrogen especially when there is scarcity in renewable capacity. More specifically, one of the regulatory hurdles identified by a 79% surveyed European hydrogen valleys is the lack of hydrogen expertise among permitting authorities (see chart below). An additional, 59% of respondents referred to “inadequate permitting procedures”, and 48% referred to “strict safety regulation” as leading European hurdles. Furthermore, there are some logistical challenges associated to the EU funding for hydrogen 18.8 billion. More specifically, such funding is channelled through many programmes, making it difficult for companies to map the best funding stream to the appropriate project.
Finance
Unlocking finance for hydrogen projects remains one of the major challenges facing the industry. For green hydrogen technology market risks, such as technological maturity, demand uncertainty, renewable power supply uncertainty, the availability of take-off purchasing agreements, tolling agreements, technological guarantees and market creation, are still the main reasons for the reluctance of many financial institutions to extend cheap finance to hydrogen projects.
Finally, in order to boost hydrogen investments, there should be better availability to long term Power Purchase Agreements (PPAs) for renewable energy, the availability of long term technological performance guarantees and offtake agreements with reliable parties (see more ). Moreover, the government could play an important role in mitigating some of these risks and make renewable hydrogen more competitive, by using, for example, instruments such as contracts for difference (CfD) on a wider scale than currently been used. Other instruments aim to blend public and private capital could be effective in reducing risks and catalyse investor confidence and boost project financing.
Conclusion
Hydrogen is set to play an important role in decarbonizing the world with a focus on the tradition sectors, hard-to-abate sectors, and the use for energy storage. The European Commission and individual countries have set ambitious targets for 2030 and 2040. Setting targets is one thing, but reaching them is another one. Currently there is a large gap between the 2030 targets and what will be reached based on the current and planned projects. This is because there are substantial challenges to hydrogen. First, there are technical and serious safety (flammability, leakage) and other challenges with hydrogen that need to be addressed, along with infrastructure needs to deal with these challenges. Second, the technologies to produce green hydrogen are not as mature as the technologies that emit considerable amount of CO2 emissions. Third, the costs to produce green hydrogen are still substantially above that of non-renewable hydrogen. These costs are strongly linked with the cost of renewable electricity and technical readiness levels of the technologies. Fourth, European regulation on hydrogen is considered complex and targets seen as unrealistic. Last but not least, the business case for hydrogen is not as clear and strong as is needed and therefore financing is more difficult. There is still relatively high uncertainty related to future hydrogen demand, along with the delay in developing renewable capacity due to problems associated to limited grid capacity and long permitting and licencing times, missing regulation, and the relative high costs of finance. Moreover, there are several barriers to growth in renewable electric power and hydrogen, such as the lack of skilled labour with challenges in attracting talent in these sectors. Overall, the hydrogen revolution is being seriously challenged and require a stepwise change in policy.
(1) FEED is a critical phase in the development of a renewable energy project, typically following the feasibility study and preceding the detailed engineering and construction phases.
(2) We note that the Netherlands has tightened its targets to reach 8 GW of hydrogen capacity by 2032.
Links in graphs and appendix in the download

