SustainaWeekly - How far is the world from a net zero trajectory?

In this edition of the SustainaWeekly, we first review the International Renewable Energy Agency’s recently published energy transition indicators, which tell us where we are and where we need to be through to 2030 and beyond to achieve a net zero scenario. In addition, what is necessary on the policy and investment side going forward. We then go on to identify eleven crucial net zero technologies. We explain each of the technologies and what they are used for. Finally, we report on the conclusions of the ECB’s first climate disclosure report on its corporate bond holdings.
Economist: A recent IRENA report shows that the world is way off track relative to a pathway to net zero. A whole host of energy transition indicators demonstrate that the gap is wide. For instance, annual renewable power capacity additions would need to more than triple to 2030. The energy intensity improvement rate would need to accelerate more than fivefold. Clean energy investment needs to almost quadruple to USD 4.4 trillion.
Sectors: We have defined a list of eleven key technologies to help to decarbonize the world by 2050. We explain each of the technologies and what they are used for. As technologies are continuously evolving because of limitations and challenges this list is not complete and will also change over time.
Strategy: The ECB has published its first climate disclosure report on its EUR 344bn corporate bond holdings purchased under the CSPP and PEPP. Emission intensity has been declining since 2018, through good luck as well as good management. In addition, it has a greater share of holdings in issuers with reduction pathways than its eligible universe.
ESG in figures: In a regular section of our weekly, we present a chart book on some of the key indicators for ESG financing and the energy transition.
What is needed by 2030 for net zero
A recent IRENA report shows that the world is way off track relative to a pathway to net zero
A whole host of energy transition indicators demonstrate that the gap is wide
For instance, annual renewable power capacity additions would need to more than triple to 2030
The energy intensity improvement rate would need to accelerate more than fivefold
Clean energy investment needs to almost quadruple to USD 4.4 trillion
The International Renewable Energy Agency (IRENA) recently published a sneak preview of its World Energy Transitions Outlook 2023 (see ). The headline message in the report pulled no punches: ‘the energy transition is off-track’ and that ‘every year, the gap between what is required and what is implemented continues to grow’. This conclusion is not contentious. There is not much in the way of disagreement from similar studies, for instance from the IEA and IPCC. In this note, we review IRENA’s energy transition indicators, which tell us where we are and where we need to be through to 2030 and beyond to achieve a net zero scenario. In addition, what is necessary on the policy and investment side to close the gap.
Energy transition indicators tell us that the gap is wide
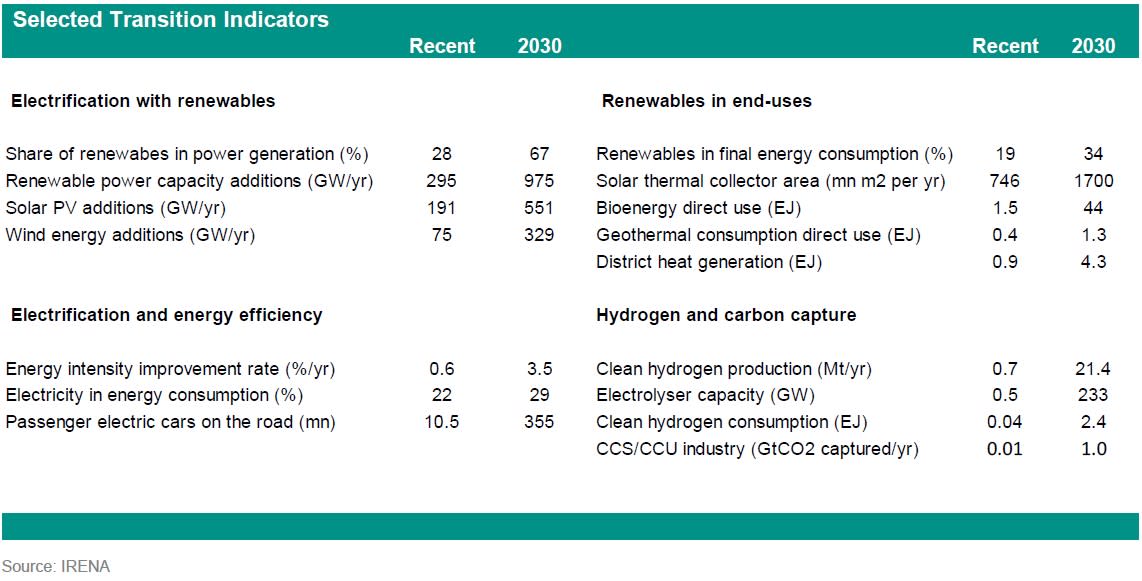
IRENA presents a range of transition indicators to compare where we are now and where would need to be through to 2030 to leave the world on track for a 1.5°C trajectory. We have summarised these indicators in the table below, spanning the different energy sectors and technologies. As can be seen, the gap across all areas between recent levels and the step up needed is large. Good examples can be found in two key focus areas for the next years: electrification and efficiency. The annual renewable power capacity added in 2020-2022 was almost double that seen in 2014-2018. At the same time, last year, 83% of all capacity additions in the power sector were renewable, compared to 57% in 2018. So significant steps have been take. Still, the absolute level of renewable additions would need to more than triple to 2030.
A similar story holds when looking at energy efficiency. One way to measure progress is the energy intensity improvement rate, which is defined as the percentage decrease in the ratio of global total energy supply per unit of GDP. The recent rate has been estimated at around 0.6% per annum, so there is an improving trend. However, according to IRENA this has to accelerate to 3.5%, while in the IEA’s Net Zero scenario, this metric needs to be in excess of 4%. Yet, the improvement in energy intensity has actually been slowing. Between 2015 and 2020 improvement averaged 1.4% per year, down from 2.1% per year over the period 2010-2015.

It is worth noting that IRENA’s 2030 net zero milestones are even sometimes on the lower end of the range. For instance, the IEA’s analysis (see ), estimates that 1020 GW of annual wind and solar capacity additions would be necessary, compared to IRENA’s 880 GW and last year’s additions of 266 GW.
Clearly, across a whole range of areas, an incredible – and perhaps improbable – acceleration in the pace of transition is necessary according to IRENA’s indicators. So what is needed to close the gap? The report does not recommend a focus on re-inventing the wheel, at least for the progress necessary this decade. Rather it asserts that a ‘significant scale up of existing solutions is paramount. For instance, for the power sector as well as transport and buildings advancing efficiency and electrification based on renewables, which will also require grid expansion and flexibility measures should be the focus. Meanwhile, clean hydrogen and sustainable biomass solutions also offer end-user solutions.

Net zero gap is also reflected in a large investment gap
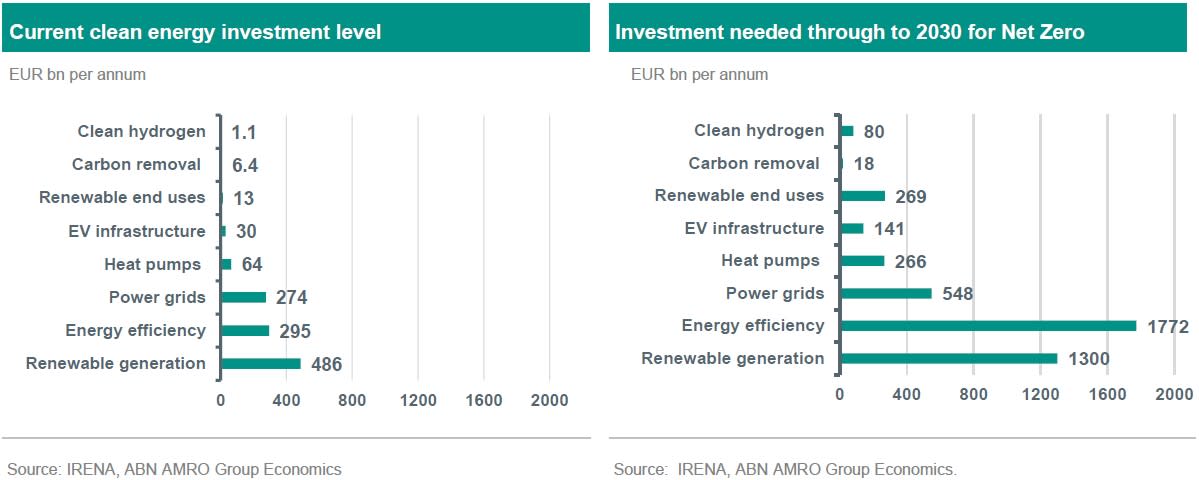
Of course the large gap across the range of transition indicators is mirrored by a large investment gap (see charts above). Currently, clean energy investment is running at around USD 1.2 trillion per annum, with the largest amounts flowing into renewable energy generation, energy conservation and efficiency and for power grids and flexibility. This overall amount is a record high. Despite this, it is no time for celebration. In fact, leave the champagne on ice.
The pace of investment is still well short of what is needed to leave the world on track for a 1.5°C trajectory. This annual amount would need to almost quadruple to roughly USD 4.4 trillion to be in line with a net zero trajectory (this is also broadly in line with the IEA’s estimates). Furthermore, even the current investment levels are highly concentrated in terms of geography and technologies. IRENA estimates that in 2022, 85% of global renewable energy investment benefitted less than 50% of the world’s population and Africa accounted for only 1% of additional capacity. This underlines the need for climate solidarity for a successful transition.
The report also provides a Planned Energy scenario, which projects the outlook based on government’s energy plans and other planned targets and policies. Under that scenario, total annual energy investment is seen at around USD 3.6 trillion per annum through to 2030. However, that includes a significant investment in fossil fuels. Indeed, an important conclusion of the report is that ‘around USD 1 trillion of annual investments in fossil fuel based technologies currently envisaged in the Planned Energy Scenario must therefore be redirected towards energy transition technologies and infrastructure’. This echoes the IEA’s conclusion that ‘there is no need for investment in new fossil fuel supply in our net zero pathway’.

