SustainaWeekly - Does climate impact oil and gas company bond spreads?

In this edition of the SustainaWeekly, we first take a closer look at how the bonds of oil and gas companies are priced with respect to climate considerations. We assess how they trade relative to the broad market, asking the question of whether negative screening strategies have had an impact once accounting for credit fundamentals. We go on to assess whether implied temperature rise scores have an impact on bond pricing between oil and gas companies. Furthermore, we analyse how their bond spreads have moved following negative ESG-related news. We go on to analyse recent trends in emissions for the EU and member states and compare the pace of reduction to targets. In addition, we look at emission trends across the continent in the large climate sectors. Finally, take a closer look at the EU’s Critical Raw Materials Act and how it compares to similar strategies published by the US and UK.
Strategist: Bond spreads of oil and gas companies with lower implied temperature rise (ITR) scores trade tighter when compared to those with high ITR. We present two case studies where we show that bond spreads have moved following negative ESG-related news. We also show that the oil and gas sector trades at wider bond levels compared to the broad market, as more investors incorporate negative screening strategies.
Economist: Many major EU countries are still well behind on their CO2 reduction targets. While the transition to low or zero carbon is now well under way in many countries and climate sectors, the pace of this transition is often still slow. Particularly in transport, CO2 reduction is lagging, while in other climate sectors CO2 reduction trends are somewhat more positive in many countries.
Policy: The EU recently published its Critical Raw Materials Act. The EU set targets for domestic capacity and aims to limit the supply from a single country by 2030. It also updated its list of critical raw materials and released a list of strategic raw materials. The US and the UK had have already published their strategies. The EU approach is similar to that of the US.
ESG in figures: In a regular section of our weekly, we present a chart book on some of the key indicators for ESG financing and the energy transition.
Do climate considerations impact oil and gas company bond spreads?
In this piece, we show that bond spreads of oil and gas companies with lower implied temperature rise (ITR) scores trade tighter when compared to those with high ITR
This seems to be a more recent trend, which has particularly gained ground after the energy crisis driven by the Russia-Ukraine war
We also examine two case studies where we show that bond spreads have moved following negative ESG-related news
We have previously argued that utilities with high exposure to renewables and/or strong ambitions to grow renewable energy have performed relatively well in 2022. Does this also apply for integrated oil and gas companies? In this piece, we analyse to what extent investors in the euro bond space are also differentiating between oil and gas majors based on their climate strategy. We also take a historical view to evaluate whether this is only a more recent trend.
Are exclusions paying off?
A lot of ESG-focused investors rely on negative screening strategies, which involve mainly fully excluding the entire oil and gas sector from their investment universe. But could these exclusion strategies have impact on bond spreads?
There are different ways of approaching this question. Firstly, we look at bond spreads of investment grade euro energy companies, and compare those with the performance of the broad investment grade euro corporate market. As shown in the chart below (left side), spreads of bonds from oil and gas companies have over the last 2 years traded at wider spread levels vis-a-vis the broader market. This is however hard to justify by looking exclusively at credit fundamentals. For example, as shown in the chart below on the right side, leverage for oil and gas companies has come down considerably over the years. In fact, these companies are even close to being net debt free at the moment (and it does not seem they are embarking on new development projects, which would normally push up debt levels again). Oil and gas prices have also risen significantly over the same period, boosting revenues. Also, the lower debt levels are reflected in the euro oil and gas index carrying an A3 rating (which was even A2 briefly over this time period), while this is BBB1 for the broad corporate market. Hence, there seems to be another reason, not related to credit risk per se, that is influencing credit spreads.
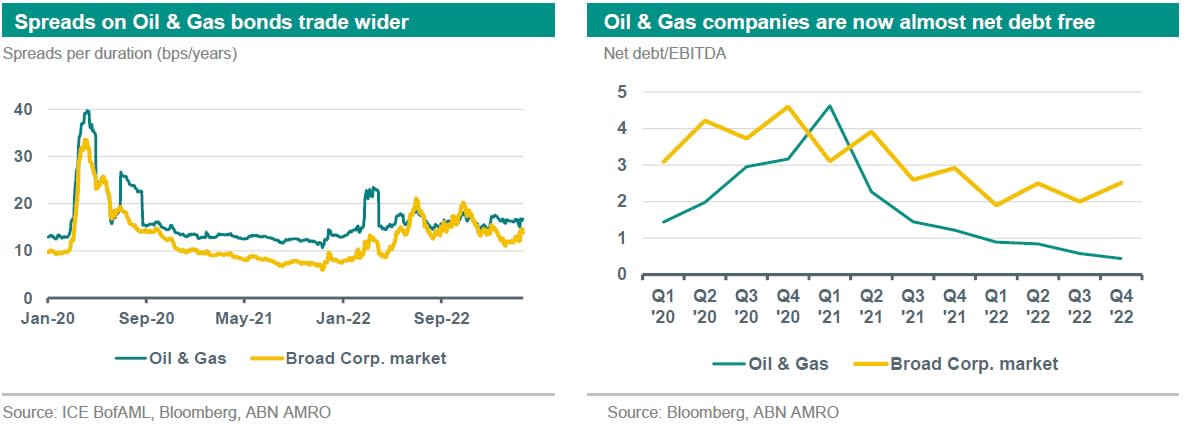
While the above is an analysis based on only a few data points, one could argue that one of the reasons for wider spreads are ESG exclusion strategies. Particularly in Europe, data shows that funds from socially responsible investments (SRI) subject to exclusions grew from EUR 184bn in 2002, to almost EUR 10tn in 2020 (according to the Global Sustainable Investment Alliance, or GSIA). With oil and gas companies being commonly part of this exclusion list, this could be one of the drivers behind the sector underperformance vs. the broader market.
Are investors differentiating amongst oil and gas companies?
For the bond investors that are still allowed to invest in oil and gas companies, are they taking climate strategies and decarbonization pathways into consideration for their investment decisions? Our results show that they do.
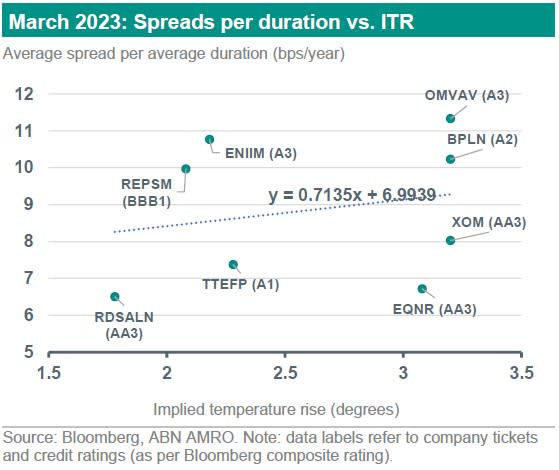
We have taken the average spreads over asset swaps in the euro bond space, and divided these by the average bond duration across different investment grade oil and gas companies. We compare this unified market valuation to an indicator of issuers’ climate strategy. As an indicator for the robustness of a company’s climate strategy, we look at the Bloomberg’s Implied Temperature Rise metric. Bloomberg has partnered with the Science Based Targets initiative (SBTi) to develop a temperature rise metric that translates corporate emission reduction forecasts into implied temperature changes. For example, a 2.5 degree implied temperature rise suggests that the company follows an emission trajectory that aligns with a scenario where global temperatures would increase by 2.5 degrees (vs pre-industrial levels). For the companies where a relevant, publicly disclosed target is not available, or where the target does not cover an important scope of the company’s emissions, the methodology assigns a default temperature score of 3.2 degrees. This is the case with British Petroleum (BP) (which only has short-term targets) and OMV. For this analysis, we focus on mid-term targets, as well as targets that take into account all emission scopes (1, 2 and 3).
As shown on the chart below, investors seem to be indeed pricing in climate strategies of oil and gas companies. This is also seen by the steepness of the trend line established from our sample of bonds. All else equal, a 1 degree higher implied temperature rise would result in bond spreads being 1bps wider. One could argue that the impact is not substantial (yet), but it is clearly an indicator that climate considerations are slowly starting to be accounted for in investment decisions. We note that this does not take into account a company’s credit rating, as we indeed show that in some cases (such as Repsol), the lower rating seems to have a big influence on bond spreads. Nevertheless, perhaps a good example to see how the climate strategy has been impacting bond spreads would be to compare Shell, Equinor and Exxon - all rated as AA3 companies. Shell has the lowest implied temperature rise amongst the three, and this also clearly results in lower spread levels. Exxon, on the other hand, is clearly lacking in its decarbonization ambitions, resulting in a relatively higher average bond spread per year of duration, even though it holds the same credit rating (and hence, probability of default) than Shell. We see the same trend with Equinor, although to a lesser extent, as bond spreads have been benefitting largely lately from the company’s exposure to gas. While one could attribute the tighter bond spreads of Shell to the ECB purchase programmes, a good counter-argument would be to look at Eni and OMV, which are both ECB-eligible and both hold a composite rating of A3. Still, Eni bond spreads perform slightly better than OMV, since Eni also has a better implied temperature rise score. Again, we could argue that investors in oil and gas companies seem to account for climate targets when allocating investment funds.
Have oil & gas investors always been “climate conscious”?
As a next step, we are interested in evaluating whether this differentiation between oil and gas companies based on their climate strategies by euro investors is a more recent trend. Below, we have replicated the same analysis but choosing four other points in time: January and August 2022 (pre- and post- energy crisis), January 2021 and January 2020 (pre- and post-Covid crisis). While spreads per duration will vary, we keep implied temperature rise variables the same. That is because unfortunately, there is no historical data availability for those. Climate strategies of oil and gas companies have evolved with time, in particular after mid-2020, which can to a certain extent impact our conclusions. However, we still argue that our results are valid, especially the ones after mid-2021, given that by then, almost all oil and gas companies of our sample had released climate targets.
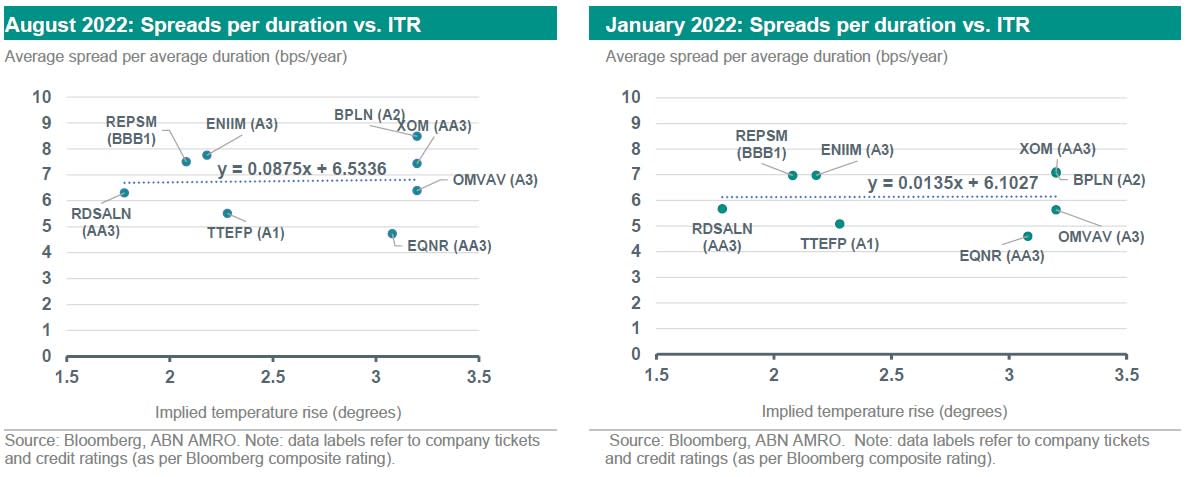
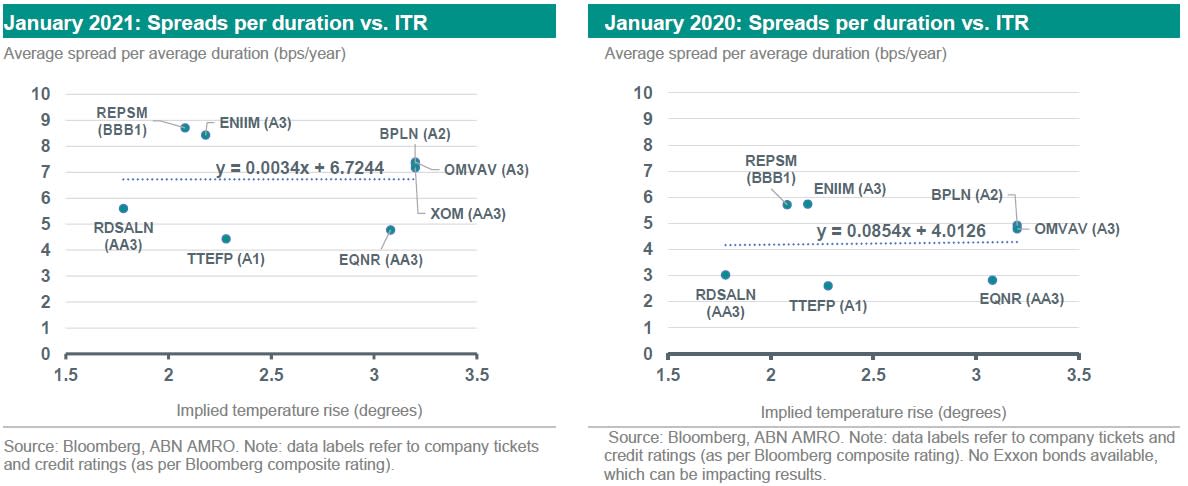
A few interesting insights arise: looking at specifically these four different points in time, it does not seem that climate strategy impacted credit spreads in the past (at least not to the extent that it seems to be now). However, as shown also by the positive slope indicator in the trendlines in the graphs above, even back then, climate ambitions by oil and gas companies seemed to be taken into account. What is also interesting to highlight is that this slope indicator has been slightly growing over time (excl. January 2020, but this sample does not include Exxon, which can be impacting results). Between January 2021 and January 2022, the indicator remained relatively constant, clearly increasing after the outbreak of the Russia-Ukraine war. As we previously noted, investors in the utility space have been putting more emphasis in companies’ exposure towards renewable energy generation. It could likely be that this also became an important factor for investors in the oil and gas universe.
To validate our results, we have looked at two case studies. More specifically, we are interested in finding out whether we can see an immediate movement in bond spreads following climate-related news.
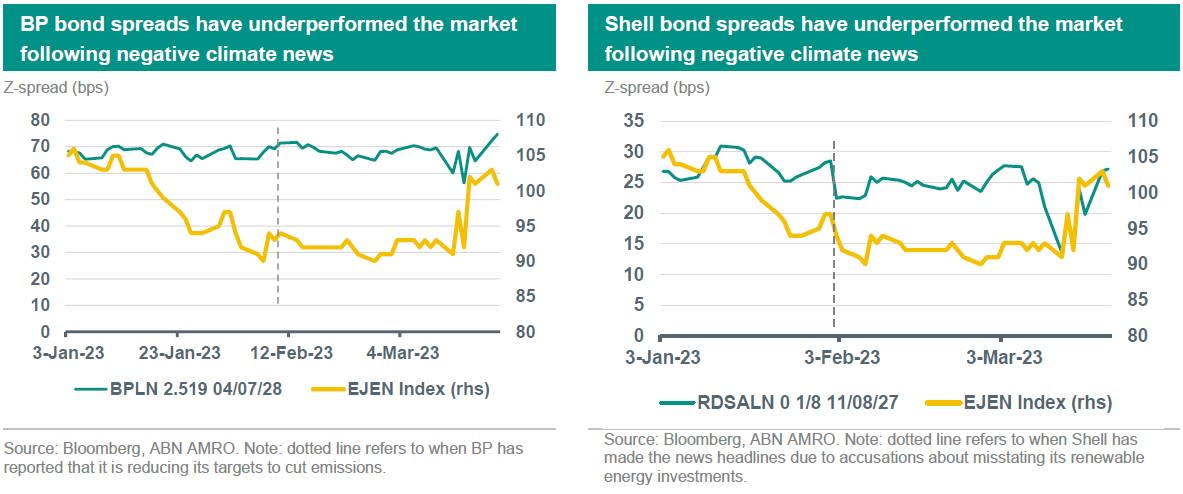
Below, we assess how spreads of BP and Shell performed this year against the broader oil and gas market when these companies hit the news due to negative ESG actions. For example, BP announced in February 2023 that it would reduce its target to cut emissions by 35-40% by the end of this decade, to a new target of only a 20-30% cut. Also Shell has been in the news recently due to a complaint lodged by a non-profit group, which has accused the company of misstating its actual spending in renewable energy.
The graphs on the next page show that in both cases, Shell and BP bond spreads have underperformed the broad market on the day or a few days after these headlines. The bonds chosen for this analysis were the ones that more closely matched the spread duration of the broad euro oil & gas index (as a way of correcting for duration effects). One could therefore attribute this to climate considerations being taken into account by investors.
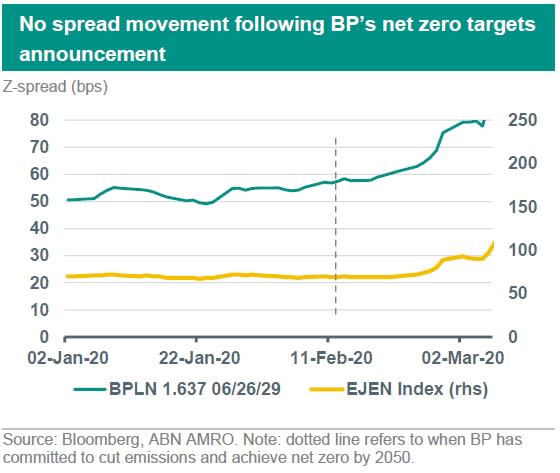
As we previously noted, this seems to be a more recent considerations by investors, which particularly seems to have gained pace after the energy crisis. We therefore also take a look at how bond spreads of BP reacted following its announcement in February 2020 that it was aiming to cut emissions to net zero by 2050 – it was one of the first oil and gas majors to announce such measure. However, as shown in the graph below, the announcement did not seem to have had any impact on bond spreads.
Climate considerations impact bond spreads
Clearly, oil and gas investors seem to differentiate companies based on their climate ambitions, a trend that was not in place a few years (or even months) ago. The Russia-Ukraine war, and the subsequent energy crisis, seem to have enlightened investors on the importance of more renewable, and consequently less fossil fuel, energy. Although the impact of climate ambitions on credit spreads of oil and gas companies does not seem to be very strong yet, we should expect this to increase as the world slowly moves away from fossil fuel. Hence, while we note that new debt requirements might be limited at the energy majors at this point, their future expansion in renewable energy will likely require a fresh stack of debt and committing to a low rise in temperatures could be helpful at this point.
Furthermore, we also show that the bond spreads of these companies seem to react to negative ESG news, highlighting that investors are conscious of climate-related issues these companies might have. Exclusions also seem to have a big impact on spreads, with the oil and gas sector trading at wider bond levels as more investors incorporate negative screening strategies.

