Transaction Trends - Who Pays What? – Housing Expenses Ratio Mapped

Analysis of 320,000 households shows a decline in the housing expense ratio for the average household in recent years. The housing expenses ratio is the percentage of income spent on housing costs. Homeowners typically have a lower housing expenses ratio; private‑sector and social‑sector renters are at comparable levels. Younger buyers and private‑sector renters have similar incomes and housing costs. The housing expenses ratio for younger buyers has risen due to mortgage interest deductions and limited buying opportunities for lower incomes. Housing allowance is essential for many recipients, preventing households from having to spend more than half their income on housing costs.


Mike Langen
Senior Economist Housing Market
Dutch housing costs among the highest in the eurozone.
In the Netherlands, house prices have roughly doubled in the past ten years. Rent levels are also continuing to rise. This fuels concerns about affordability, making the housing market one of today’s most debated political topics. Many note that it has become nearly impossible to find an affordable home, whether renting privately or buying. Waiting lists for social housing can stretch ten years or longer in some regions. What is often overlooked is that discussions typically revolve around prices alone, without correcting for inflation—while wages generally rise with inflation too. Therefore, assessing affordability requires looking at both prices and incomes. The ratio of housing costs to income—the housing expenses ratio—provides a more complete picture of the financial pressure households face. According to Eurostat, Dutch households in 2024 spent on average 20.5% of disposable income on housing costs. Households above the median income spent 17.6%, while those below the median spent 41.9%. This places the Netherlands among the European countries with the highest housing cost burdens.
Although the housing expenses ratio is a valuable indicator of affordability, the available data on this is limited.
Although housing expenses as a percentage of household income, or in short the housing expenses ratio, is a better measure for housing affordability, it does have some limitations. The main issue is that we have less information than when using prices. Due to differences in income and costs per household, we cannot compare average prices and incomes. Instead, we need to collect housing expenses and incomes at the household level, so that we have sufficient control over the differences between income and housing situation (renting/buying). Statistics Netherlands (CBS) collects this from households once a year. For example, this shows that the median costs for homeowners (17.1%) are lower than for tenants of corporation housing (25.4%) and tenants of non-corporation housing (30.2%). This shows that the housing situation already makes a big difference. Annual data are less suitable for assessing short-term developments, such as interest rate increases. The most recent CBS data from February 2026 are provisional and date from 2023, which causes delays. For 2022, housing expenses ratios were based on smaller, less accurate surveys.
We present a new method for calculating the housing expense ratio, using transaction data.
Using anonymized and aggregated bank transaction data, we demonstrate how the housing expense ratio can be calculated in a new way. By examining the flow of money to and from bank accounts, we gain a clear and timely picture of costs and income. This enables us, in follow-up research, to track monthly or quarterly developments in the housing expense ratio. Our approach is therefore more up-to-date and takes into account differences in living situations (buying/renting) and other socioeconomic characteristics.
This analysis provides an initial overview of how housing expense ratios are distributed.
For this research, we examine the period from 2019 to 2025. To ensure that the definitions of housing expenses and income are straightforward, we focus on households with income from salary or benefits. Households receiving income from pensions or who are self-employed are excluded from this analysis. Our final dataset consists of an unbalanced panel dataset [1] of approximately 320,000 households per year. In this study, we present a few initial insights. However, with the new data, we can also zoom in on various socioeconomic groups and regions in future projects and improve our predictions for economic market indicators, such as house prices.
Method
We include all fixed housing expenses.
For this analysis, we look at the average annual expenditures per household. We have chosen to calculate this average on a yearly basis, so that interim rent changes, yearly settlements, and refunds from, for example, energy companies are included. The costs we include within the definition of fixed housing expenses are direct housing costs such as rent or mortgage payments. Additionally, we also include costs that are inseparably linked to living, such as HOA contributions and gas, water, and electricity. For a household to be included in the analysis, there must generally be a mortgage or rent payment every month and expenditures for gas, water, and electricity. As a result, homeowners with a fully paid-off mortgage are not included in this analysis. To determine the ownership situation, we check whether the household pays a mortgage or rent. To further distinguish between social renters and private sector renters, we check whether the rent payment is above or below the annual social rent threshold.
In addition to salary and benefits, we also include subsidies and tax refunds as income.
To arrive at a ratio, it is necessary to divide these fixed housing expenses by income. When calculating household income, we look at incoming (net) salary, benefits, and (rental) allowance payments. In addition, we also include (refunds) from income tax. This is important since a large portion stems from the mortgage interest deduction (MID) [2]. This means that income also includes the MID for homeowners. However, we do not know what portion of the income tax is attributable to the MID. Some households, for example, have mortgages with a low interest rate and some must pay high wealth taxes (box 3), so their tax refund is lower or they sometimes even have to pay taxes. By adding together the rental allowance and the annual tax settlement, we estimate the annual effective housing expense ratio, which may differ slightly from the observed monthly payments. The housing expense ratio calculated by CBS differs slightly because CBS subtracts the rental allowance and the MID from the housing expenditures. We cannot apply the same methodology, since we observe the MID together with box 3 tax settlements. This would result in a distorted picture for homeowners with substantial wealth and a low mortgage, leading to extremely high housing expense ratios, even though in reality this is almost entirely caused by the box 3 tax.
Housing expenses decrease over time
Homeowners have lower housing expenses than renters in both segments.
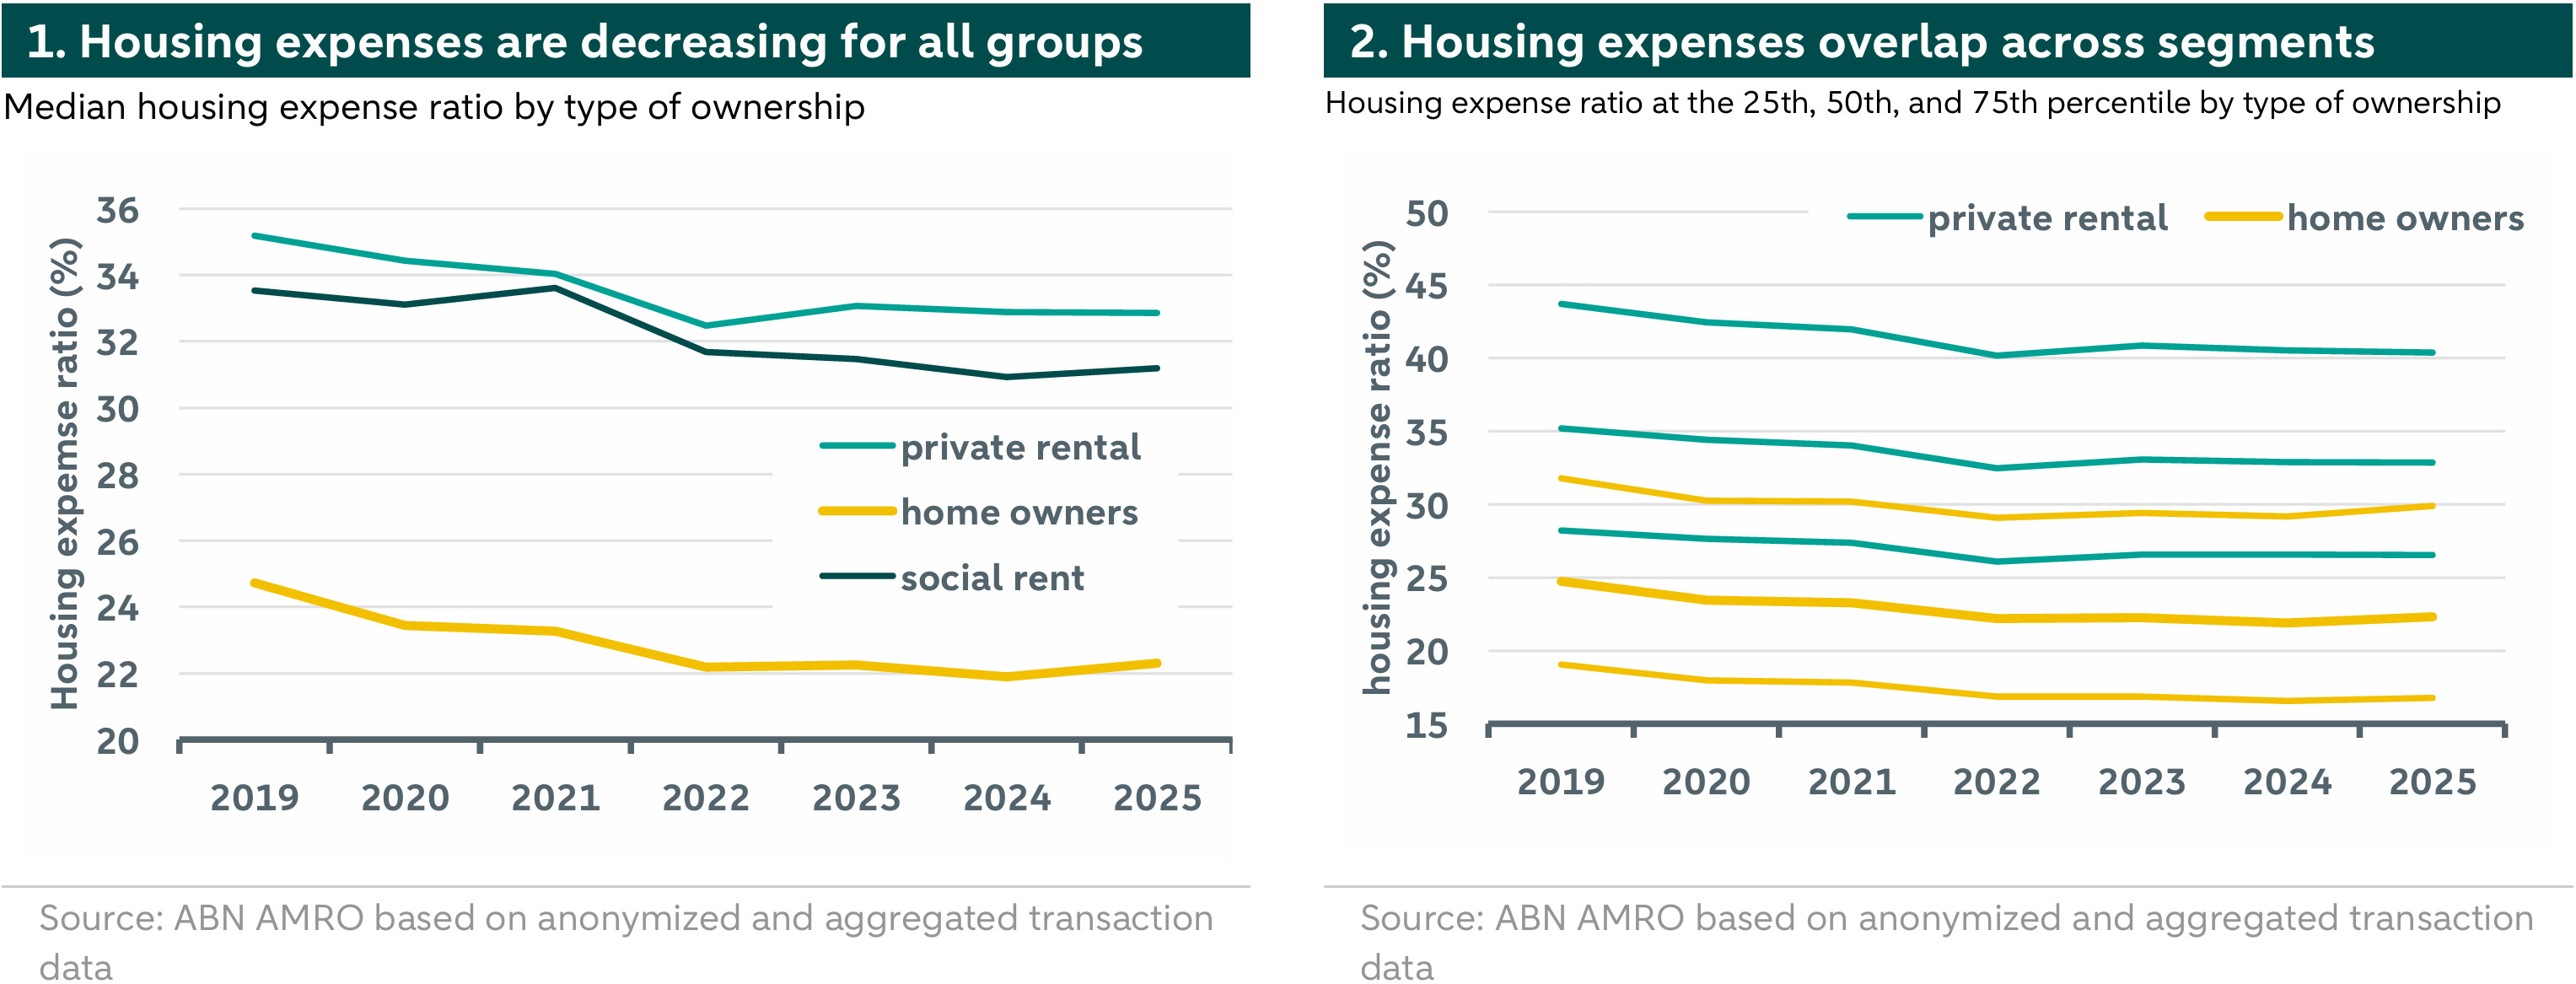
Figure 1 shows the median housing expense ratio for renters and for homeowners with a mortgage. The data reveals that the housing expense ratio for homeowners with a mortgage is generally lower than that for renters. Both groups have also experienced a downward trend in recent years. For renters, the housing expense ratio decreases from 33.9% in 2019 to 31.5% at the end of 2025 (for both groups of renters) and for homeowners from 24.7% in 2019 to 22.3% in 2025. This trend is consistent with CBS statistics, which also show a declining trend in the housing expense ratio. We see that renters in the social sector have lower housing expenses. However, contrary to what CBS figures indicate, we observe a much smaller difference in median housing expenses between the social and private rental sectors. This can partly be explained by definitions, since CBS defines the segment based on homes owned by corporations and non-corporations, while we define the segment based on actual rental payments [3]. Overall, our housing expense ratios are slightly higher than those of CBS, which can be explained by the aforementioned difference in calculation. Additionally, we do not include households that have paid off their homes or receive a pension, resulting in our median housing expenses being higher.
When we look at a broader spectrum, the housing expense ratios across segments overlap.
Looking only at the median housing expense ratio does not provide a complete picture. Naturally, there is considerable variation and overlap between different groups. In 2025, half of all households in the social rental segment—those between the 25th and 75th percentile—had a housing expense ratio between 25% and 39%. For the private rental market, half of households had housing expenses between 26.5% and 40.4%. This again shows a certain overlap between the groups. Figure 2 illustrates the situation for households in the private rental market and for homeowners over time. For homeowners with a mortgage in 2025, the housing expense ratio ranged from 16.8% to 30%, which is lower than for the other groups.
Income differences explain the lower housing expense ratios for homeowners.
Households with a mortgage have approximately 20% higher housing expenses, but due to a higher average income, the median housing expense ratio for this group is far below that of renters (both social and private). Within the rental segment, we also observe some differences. For households in the social rental segment, we saw around 2021 a housing expense ratio equal to that in the private rental market. However, after 2021, this begins to diverge slightly. This can partly be explained by the income-dependent rent reduction in the social rental sector in 2023. In the private sector, we saw strong growth in housing expenses through 2024 due to sharply increased rents. However, after 2024, we see a trend reversal, presumably due to the Affordable Rent Act, which causes housing expenses for this group to stagnate in 2025. When we then look at the income side for both groups, we see a clear difference, with the group in the private rental sector earning about 40% more.
Differences between age groups are large for buyers, but small for renters
Starters are facing rising housing expense ratios despite higher incomes.
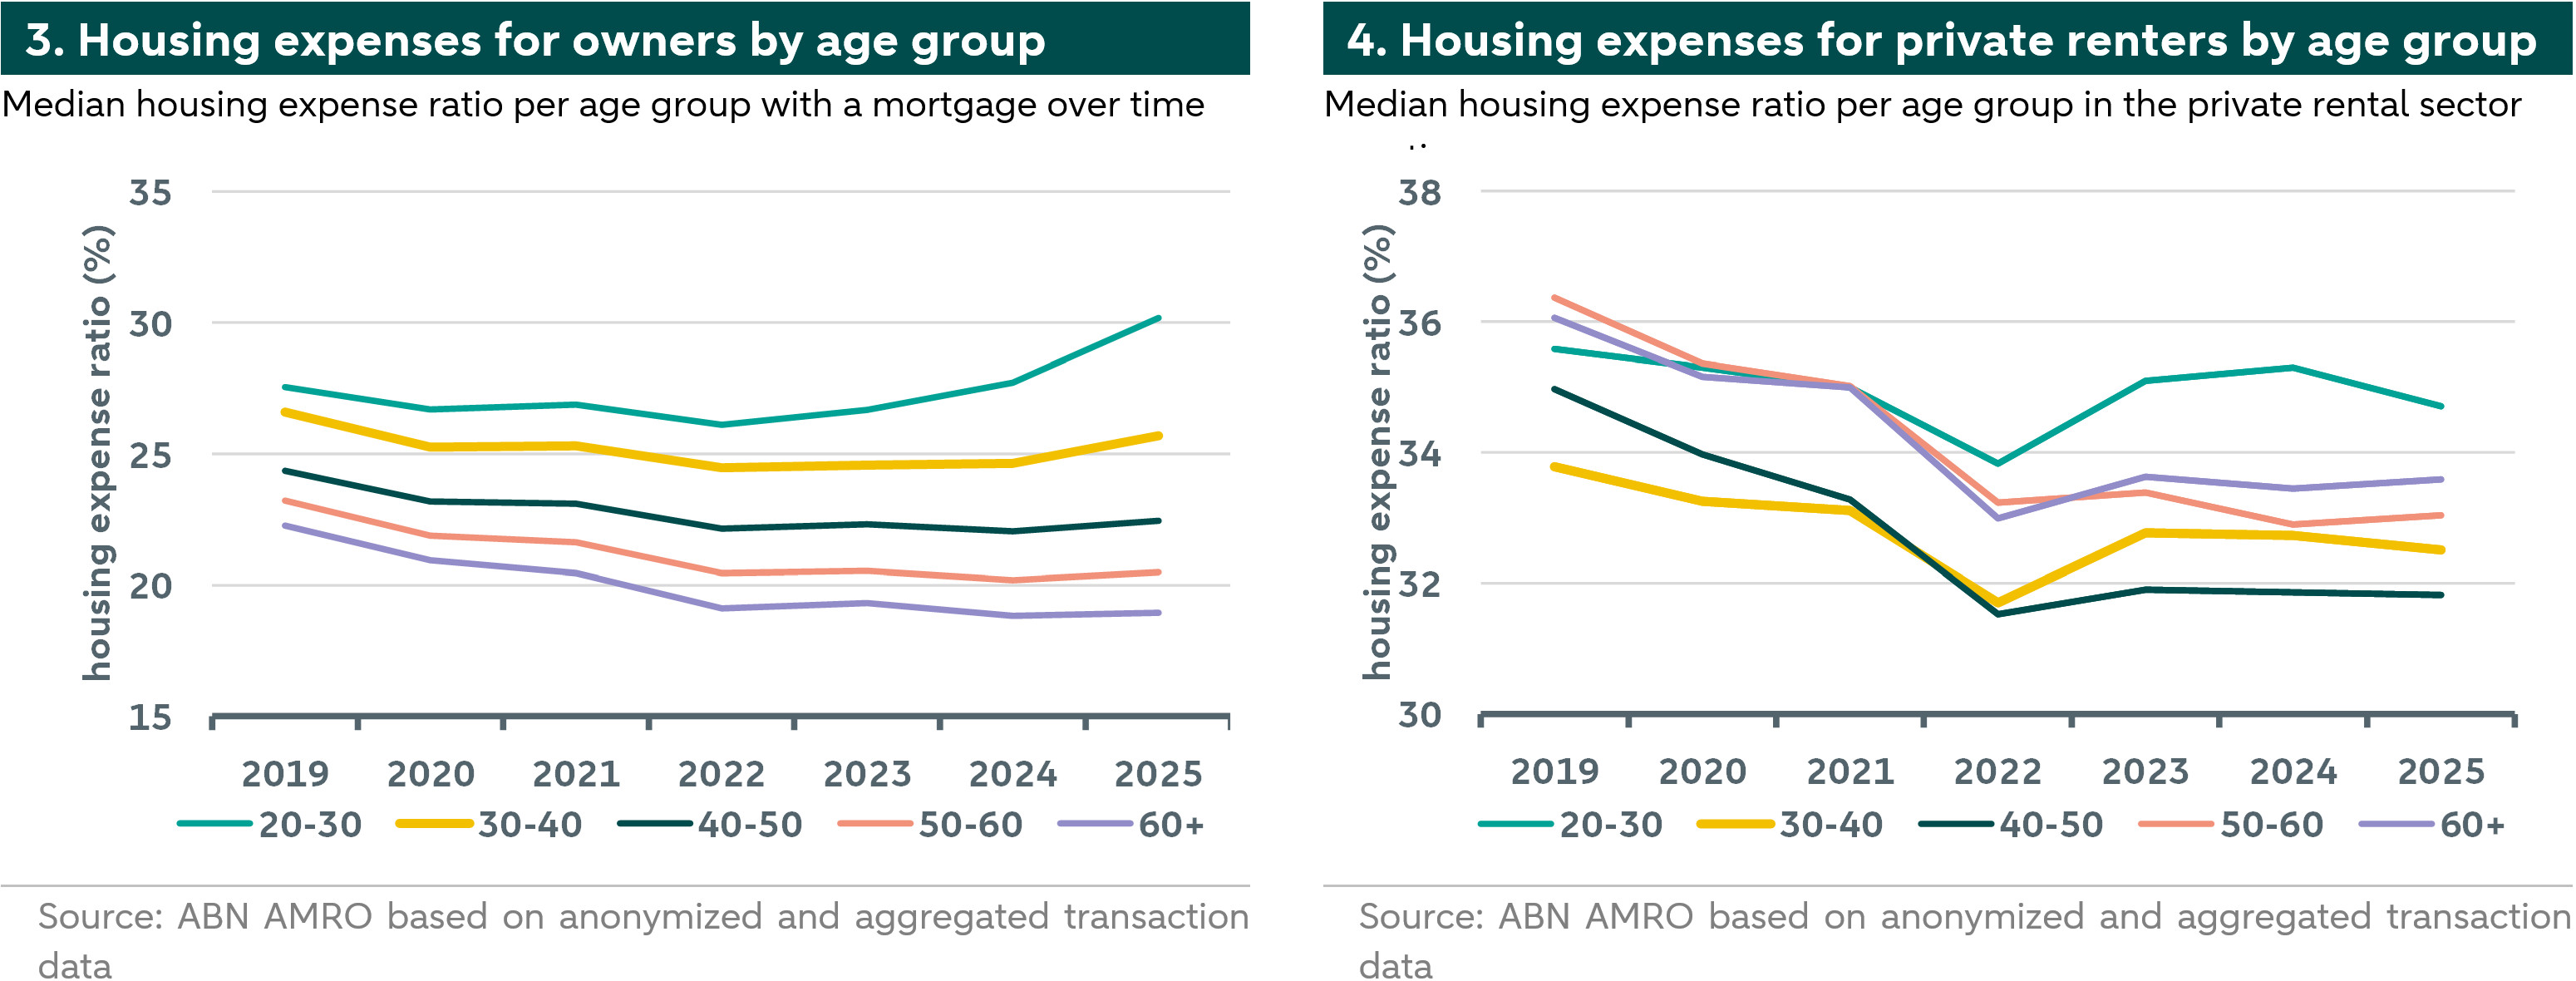
Although we look at the median homeowners and the median private renters, this does not mean that these two groups are entirely comparable. For example, homeowners are often older, which means they usually have more money. That is why in Figure 3, we have broken down the housing expense ratio by age group. We see a more nuanced picture than before, with a downward trend for all households over 40, a slight increase for households between 30 and 40, and a rising trend for households between 20 and 30 years old, often first-time buyers. Underlying this is a composition effect, as the younger segments include more new mortgage holders and thus, since 2022, have faced higher mortgage interest rates. Among older households, most have existing mortgages, often at lower interest rates. This latter group faces a refinancing risk when the fixed-rate period ends. However, this will have a less significant impact because the mortgage has already been partially paid off. Additionally, we observe a much stronger wage growth for this youngest group compared to other age groups. This above-average wage growth is largely explained by the fact that, within this age category, only households with the highest incomes can still buy a home. Under the current lending standards, this higher income allows them to spend a larger portion of their net salary on mortgage payments, which is the main component of the fixed housing expense ratio.
Young renters in the private market are less affected by rising housing expense ratios.
For comparison, Figure 5 shows the housing expense ratios by age group in the private rental segment. Overall, these ratios are higher than those for homeowners and are closer together across different age groups. The underlying data reveal similar income growth among the younger group. However, because rents in this segment have stagnated since 2023, we do not see an upward trend in the housing expense ratio for young people.
Private sector tenants cannot always easily buy a home
Young homeowners and private market tenants have comparable housing expense ratios.
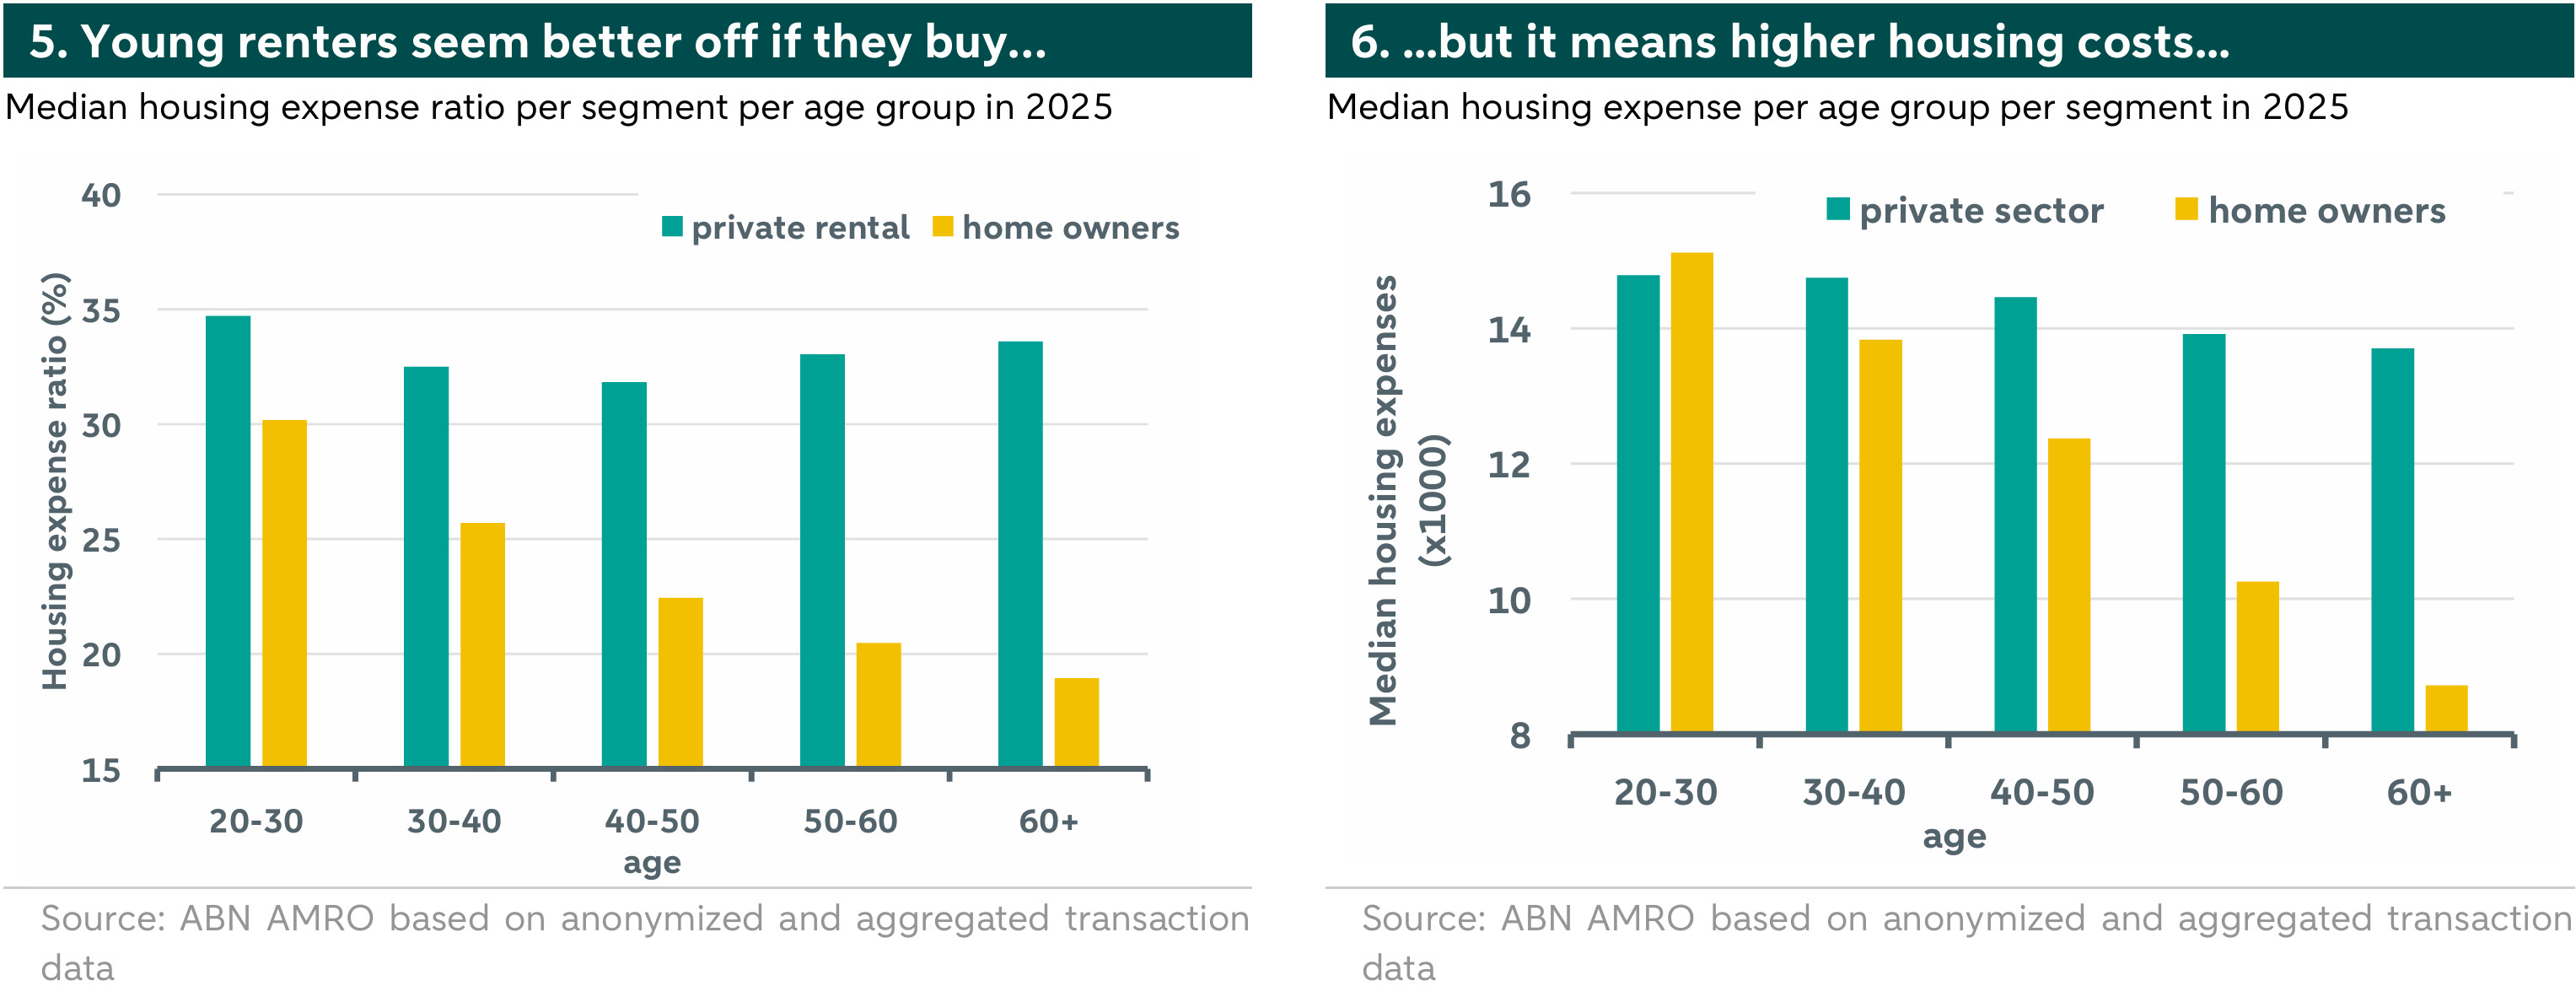
It is often heard that tenants in the private market might be better off if they buy a house. Figure 2 seems to support this argument by showing that there is an overlap in housing expense ratios between renting and owning. The group of private sector tenants mainly consists of young people who generally have lower incomes. Additionally, they often moved into their homes more recently. Therefore, the question of whether buying is always more advantageous is better answered if we break it down by age. Figure 5 shows the median housing expense ratio by age group per segment for 2025. We see that the housing expense ratios for younger households are very close to each other, but diverge with age. The main component in the older age class is found on the spending side, where we see a much steeper decline in expenses for homeowners than for tenants in the private sector.
Young buyers and young renters differ little from each other.
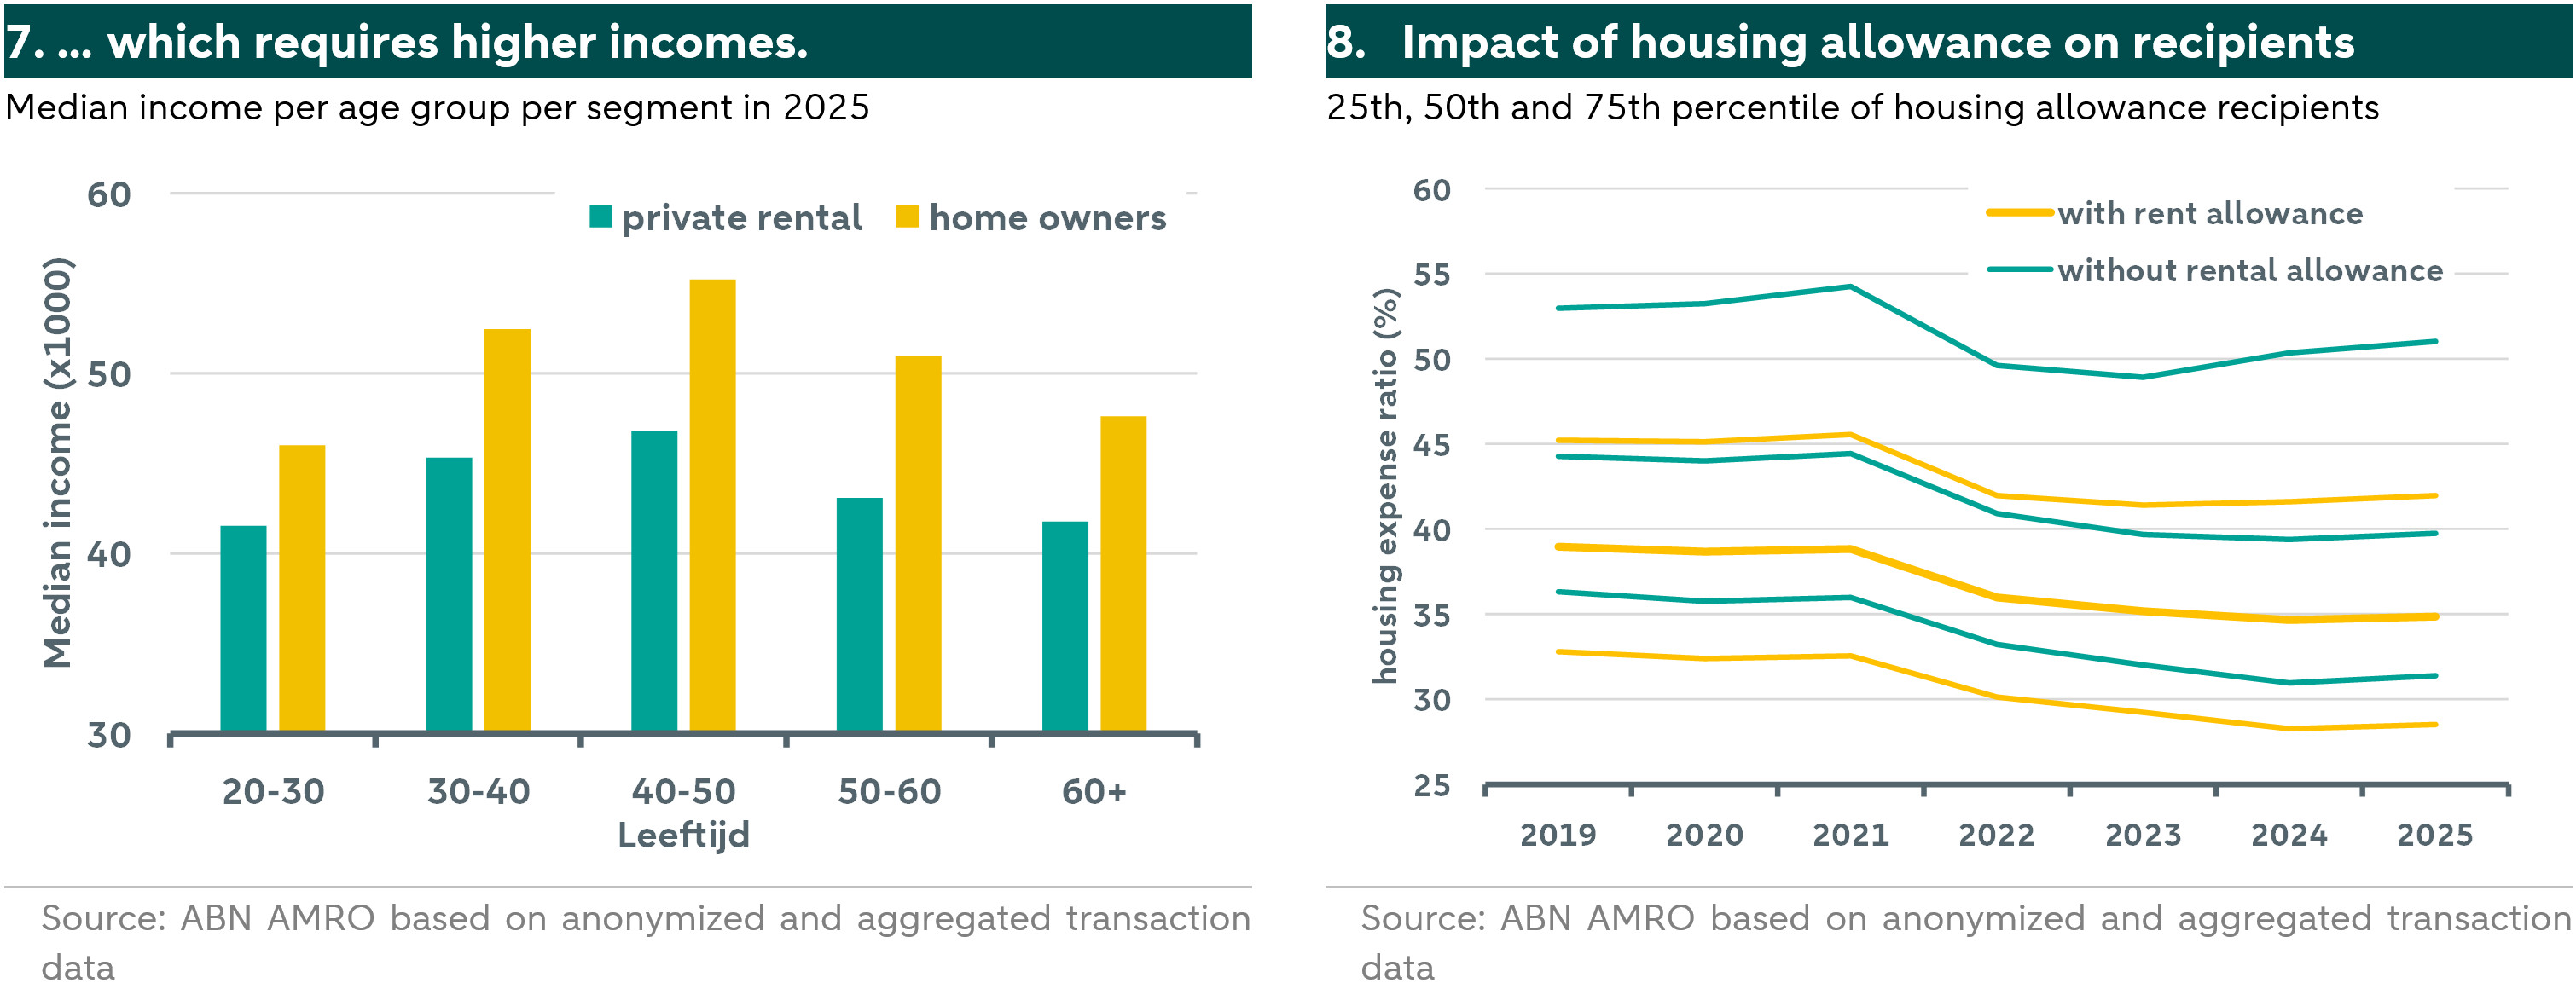
Figure 6 shows how expenditures vary between both groups. In the youngest category, those aged 20-30, homeowners typically spend slightly more on housing costs than their peers who rent in the private sector. However, this extra few hundred euros cannot explain the 5% difference seen in Figure 6. That’s why we look at the income side in Figure 7. Here, we see a difference of about 5,000 euros. However, after excluding the mortgage interest deduction, only about half of this remains. Roughly, the impact on the maximum borrowing capacity for a mortgage is 20,000 euros. Still, salary does not explain why one person buys and another rents. For example, in large cities, more people rent on the private market. There are also other smaller components, such as maintenance costs, which are the responsibility of buyers but not of renters, and these are outside the scope of this analysis.
Housing allowance is essential for a large portion of recipients
The effect of housing allowance is quite controversial, but it has just been expanded.
Finally, we look at the effect of housing allowance on the fixed housing cost ratio. Since 2026, the maximum rent cap has been abolished, allowing those renting in this segment to also receive housing allowance. In addition, the age limit for young people has been lowered from 23 to 21 years. At the same time, the CPB advises reducing housing subsidies, such as mortgage interest deduction and rent subsidies, due to their price-increasing effect and the adverse consequences for ‘outsiders’.
For people with the highest housing costs, housing allowance is almost unavoidable.
Figure 8 illustrates the impact of housing allowance on the ratio between housing expenses and income among recipients. The data shows that housing allowance recipients with the highest housing cost ratios experience an effect of more than 10%. Thanks to the housing allowance, recipients in the highest quartile are prevented from spending more than 50% of their income on housing costs. Although the NIBUD 50-30-20 rule for healthy household finances is not directly comparable to the housing cost ratio used in our analysis, it does illustrate that the housing component alone—excluding groceries, insurance, transportation, and subscriptions—consumes a substantial portion of income. This emphasizes how dependent many housing allowance recipients are on this financial support.
Conclusion
This study offers a fresh perspective on the development of housing cost ratios in the Netherlands. By using anonymized transaction data, we are able to analyze housing cost ratios more rapidly and across various cross-sections. Our findings show that the results up to 2023 are consistent with those of CBS and that the downward trend continues in 2024 and 2025. This is relevant, as house prices reflect only one aspect of the market. Housing cost ratios provide additional insights and improve forecasts regarding the housing market, where financial sustainability is essential to prevent unwanted market corrections. This approach is also applied in forecasts by, among others, the .
Additionally, within this study we have distinguished between different groups in the housing market. Our analysis shows that social renters and private sector renters have comparable housing cost ratios, with relatively limited differences within both categories. Among homeowners, the differences between age groups are more significant; younger buyers and private sector renters are close to each other in terms of ratio, while older age classes show greater deviations. Furthermore, our research demonstrates that the transition from renting to buying for private sector renters is less straightforward than is often assumed. We also conclude that housing allowance remains crucial for a large portion of recipient households.
Finally, we observe that despite the downward trend in median housing costs within most segments, not every individual benefits from this development. Some households are actually experiencing a deterioration compared to a few years ago. This study primarily focuses on housing affordability and does not address housing availability.