US - Schrödinger’s excess savings

Pandemic induced excess savings have not been depleted. Depending on where you look, excess savings were either never there (low income households), or still there (high income households). Middle income households obtained and depleted excess savings. Depletion of excess savings coincides with normalization of consumption and the rise in credit card and car payment defaults. Remaining excess savings in upper tail of income distribution unlikely to boost consumption.
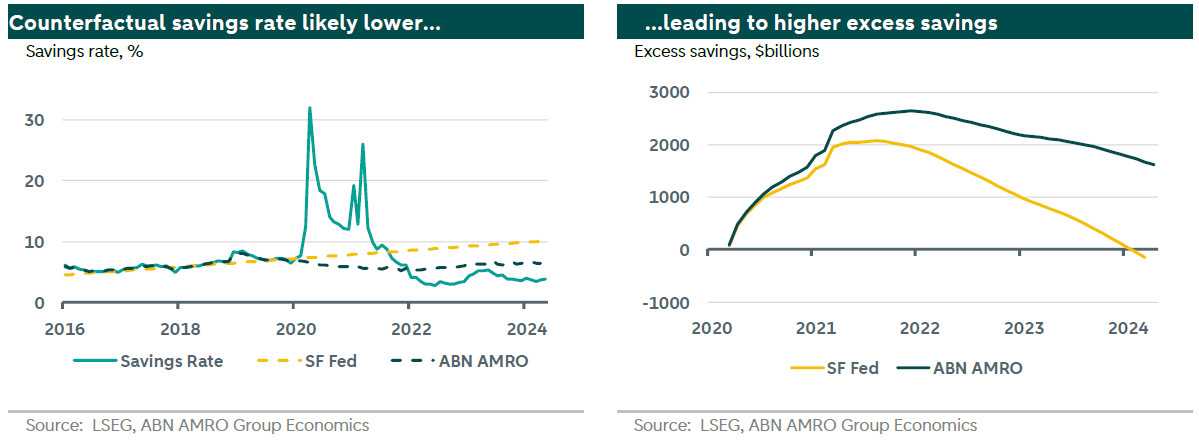
During the pandemic, households accumulated savings rapidly as a result of financial support by the government and a decline in consumer spending induced by social distancing. In May of this year, researchers at the San Francisco Fed reported that the stock of excess savings, which reached a peak of $2.1 trillion, was depleted in March of 2024. In this note, we re-evaluate that statement by refining the modelling of the counterfactual savings rate, and digging into household heterogeneity using Distributional Financial Accounts data. We estimate that cumulative excess savings peaked substantially higher, and that there is still have a stock of at least $1.6 trillion as of May 2024. The catch is that the stock of savings is held almost exclusively by the top 20% income households. The bottom 20% never accumulated any excess savings at all, rather saving less than pre-pandemic trends would suggest. For the vast majority of American households, the excess savings were already depleted in the first quarter of 2023, after which we start to see a normalization of consumer spending, and increases in consumer credit delinquencies. On the other hand, since the remaining excess savings are in the hands of high income households, they are unlikely to still boost consumption.

Excess savings are not depleted
We estimate the counterfactual savings rate to be substantially below the one implied by the San Francisco Fed analysis. Rather than extrapolating the 2016-2019 trend, which showed an increasing savings rate, we model the savings rate since based on a variety of contemporaneous and lagged economic fundamentals, including, inter alia, interest rates, prices, labor market conditions and demographic changes. Then, based on the actual economic developments in the post-covid period, we produce an alternative counterfactual. Rather than an average implied savings rate of 8.8%, we estimate an average of 6.0% over the same period. The lower counterfactual savings rate mechanically increases the estimate of excess savings. We estimate a substantially higher peak occurring about a quarter later. Importantly, due to a lower assumption on the counterfactual aggregate savings rate, the excess savings decline more slowly, and still stand at $1.6 trillion.
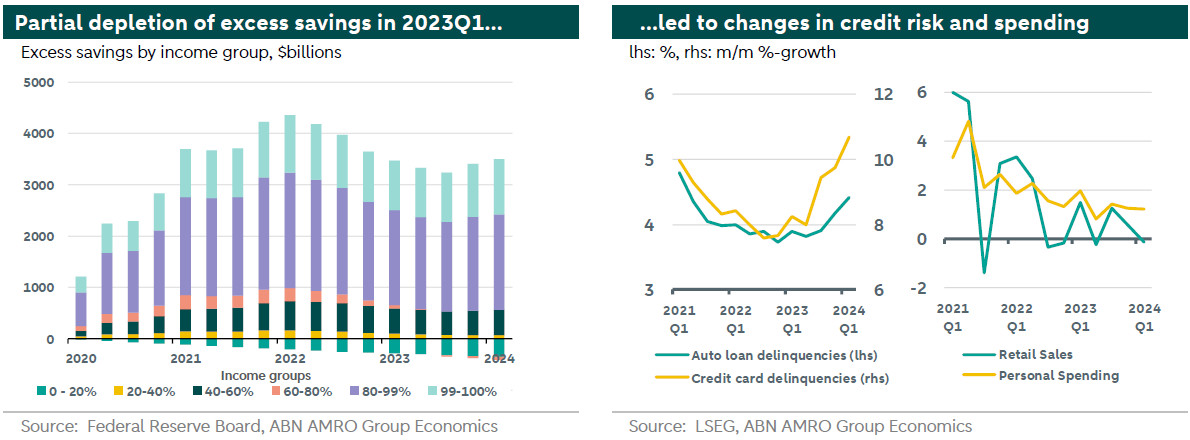
Another reason to think that excess savings are not yet depleted comes from distributional financial accounts data, which provides quarterly estimates of the distribution of various measures of household wealth, including liquid assets. We construct excess savings by household income group as the difference between the sum of deposits and money market fund shares, and a counterfactual based on a regression trend over 2016-2019. Based on this method, aggregate excess savings peak even higher, at $4.0 trillion, and have since only come down to $3.0 trillion. While the level is different, the pace of decline since peak is similar to our estimates based on the savings rate.

Excess savings were distributed unevenly
That same analysis provides us with a decomposition of excess savings into various demographic groups. At the time of writing, excess savings are almost entirely in the accounts of the top 20% of income households. On the other hand, the bottom 20% never even accumulated any excess savings, rather dis-saving relative to trend. The three groups in the 20-80% bracket did build up excess savings, but largely depleted them by the first quarter of 2023 (1). A decomposition by demographic generation shows that all generations built up savings at a similar rate (2), except for Millenials who built up their stock twice as fast at the other generations. After the peak in the beginning of 2022, Babyboomers and Millenials have gradually reduced their excess savings at a pace similar to the aggregate seen in the chart, to about 80% of its peak. In contrast, GenX spent its excess savings three times as quickly, with about 40% left, while the silent generation has held on to its extra savings.
Compared to the SF Fed estimates of depletion in 2024 Q1, the earlier depletion of excess savings for the bottom 80%-income households in 2023 Q1 aligns better with the slow but steady build-up of credit card and auto loan delinquency, as well as the normalization of retail sales and personal consumption growth. The difference in assessment does not change our on the state of the economy or the Fed, but helps to better understand recent developments. The large stock of excess savings in the upper tail of the distribution is unlikely to flow into consumption any time soon. At the same time, since its level is relatively stable, it is also unlikely to put much price pressure on financial assets.
(1) Two comments are in order. First, the 40-60% income group still appears to have substantial excess savings. This is predominantly driven by a very low estimate of counterfactual liquid assets, due to an actual decrease in holdings over 2016-2019. Based on the adjacent income groups, we expect that this group has depleted its excess savings too. Second, the analysis is based on nominal asset holdings. When adjusting for inflation, the overall picture remains, but real excess savings may have been depleted a quarter earlier.
(2) The rate of excess savings accumulation is defined as the month-on-month change in the ratio of estimated excess savings over total savings.
